Tests of dms Sensitivity
Last Update: 10-Mar-06
Index
- Generator Files
- toy Mc Inputs
- Data ToyMC Comparison of σ_fit(A)
- "Luckiness" Factor
- Average logL Distributions
- Single Experiment logL Distributions
Main Toy MC Inputs
| Parameter |
Value |
| Full Details |
here
|
| Experiments |
1000 generated |
| Events / Exp |
800 |
| Dilution |
0.44 (constant) |
| Lxy Smearing |
2 Gaussian
o σ_1 = σ(evt)
o σ_2 = 0.03 cm
o f_1 = 0.78
|
| Fractions |
o f(Bs --> Ds mu nu) = 0.679
o f(Bd --> Ds D X) = 0.271
o f(prompt) = 0.051
|
Comparison of Ampl Fit Errors
Compare the average errors found on the fitted amplitude at various
values of Δms between Sergey's fits in the data
and the ToyMC.
Note: the input values of the ToyMC above were tuned to achieve this
level of agreement.
| dms |
σ(A(dms)) - Data |
<σ(A(dms))> - ToyMC |
| 14 ps-1 |
0.569 |
0.727 (10 exps) |
| 19 ps-1 |
1.067 |
1.053 (1000 exps) |
| 25 ps-1 |
1.920 |
1.558 (10 exps) |
Measures of Luckiness
Question: "Luckiness" is estimated by answering the following
question.
Given:
- a true value of Δms = 19
ps-1
- the error on the fitted amplitude at 19 that we observe in the
data: σ(A(19)) = 1.067
Then:
- How often would we expect to observe a fitted amplitude that
deviates from zero at the 95% CL or greater?
- i.e. how often is A(19)fit >
1.645 * σ(A(19))obs\
(= 1.755)
Answer:
In 1000 ToyMC experiments, described above, 228 (22.8%) have
A(19)fit > 1.755.
Below is a plot of the distribution of fitted amplitudes for the 1000
experiments.
More details are available
here.

Average logL Distributions
Question: Is our logL vs. Δms (particularly
the width of the minimum) consistent with expectation.
Answer:
In 100 Toy MC experiments, for each experiment
- calculate -logL at a number of different
values of Δms, with A fixed to 1
- find the minimum of this distibution: logL(min) & dms(min)
- subtract logL(min) from logL at each dms point. This gives the
logL deviation from the minimum at each value of dms
(ΔlogL(dms))
which should be distributed as a chi2
Plotted below (top plot) is the average ± rms values
of ΔlogL vs. dms.
In the bottom plot, the distribution of dms(min) values is
plotted. The mean of this distribution is
(more details
here):
<dms(min)> = 19.08 ± 4.32(rms)
In the figure below, the dashed line corresponds to 95% CL and the
dotted line is 90% CL.
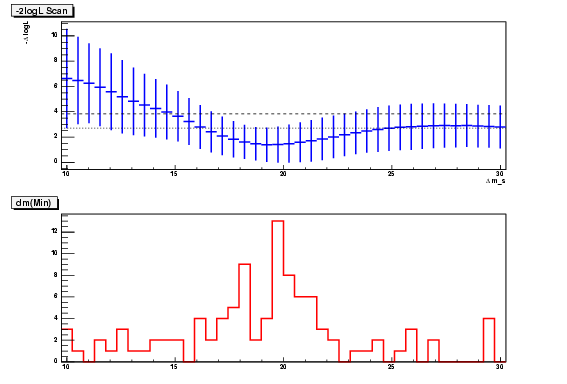
Comments:
-
This plot again shows that we are lucky to observe a 95% CL
signal, however, the region 16-23 fits easily within the spread in
ΔlogL values observed.
-
The plateau in logL plot occurs at approximately the same place as
in data (~25 in the ToyMC, ~23 in data).
Single Experiment logL Distributions
Question: For those ToyMC experiments that observe a 95% CL
signal, is the width of the logL curve consistent with that in data?
Answer: in progress...