DESY II Lumi Spectrometer Beam Test (Jan/22-Feb/15 2001)

People: M. Helbich, S. Paganis, B. Schmidke
GENERAL COMMENTS
People: M. Helbich, S. Paganis, B. Schmidke

| Watch DESYII live!!! |
|
| Check our BeamTest Review Log |
|
| Click on Thumbs for a postscript formatted picture. |
|
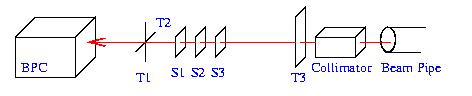
| Schematic of the Beam Test setup: |
|
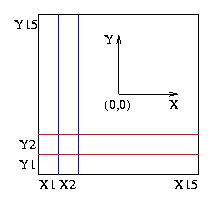
| Coordinate system of front face (as viewed from the target) of the north module: |
| |
The width of each scintillator strip is 8mm. | One of our goals is to measure the strip width for all channels.
The Wavelength shifters are positioned at the top and
right side of the face shown in the figure.
|

| Monday Jan/22/2001: First Results from North Calorimeter (BPCn) |
|
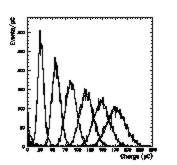
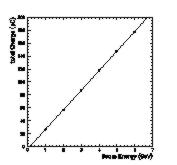
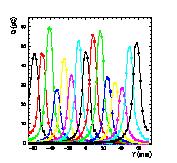
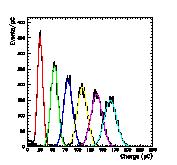
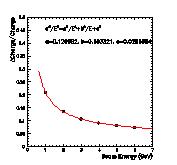
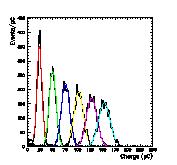
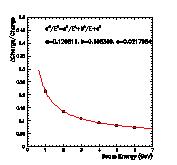
Total charge (1pC=4ADC counts) distribution for 6
different beam energies (1-6 GeV)
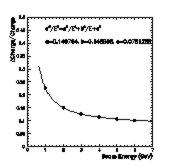
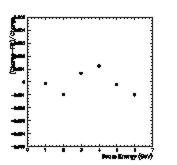
and BPCn resolution (dE/E) versus beam energy.
There is a significant constant term (8%) which can be
attributed to the fact that we have not performed a
channel to channel calibration yet. From X,Y scans
(see later results) we observed a roughly 50% max variation
which contributes to the constant term. During the energy
runs we used (T1.and.T2.and.T3) with a 6x6mm collimator which
gave us a 30Hz rate. Under this configuration the beam spot
spreads to more than one strip.
| |
|
|
|
| Monday Jan/22/2001: First Results from North Calorimeter (BPCn) |
|
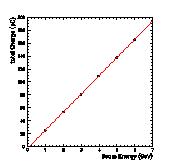
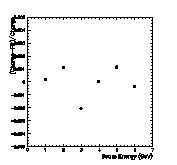
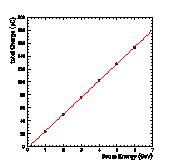
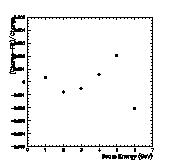
Linear fit of the mean of the charge distributions. The mean was
obtained by a Gaussian fit shown in the response picture, and
Residuals (or percentage deviation from linear behavior):
| |
|
|
|
| Friday Jan/26/2001: |
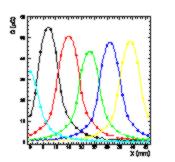
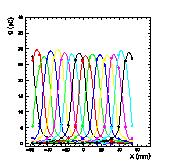
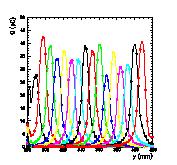
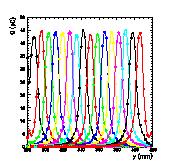
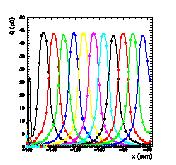
| X-Y scans: We used a 5GeV beam, the usual online trigger (T1.and.T2.and.T3), 6x6mm collimator aperture but offline we included a 3mm hole (diameter) veto (.not.S3) to restrict the beam spot on a single scintillator strip. The rates are low 8min/1000 events. The following figure shows the mean charge response versus detector X position as given by a step motor (per 2mm steps). The detector center is roughly at X=0 Y=0. Each colored line represents the response of a particular channel: light blue=X8, black=X9 etc. Fit of these 6 curves gives a strip by strip separation of 8mm +/- 100microns. We can use such scans for strip to strip equal response calibration. |
|
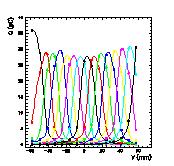
| Saturday Jan/27/2001: |
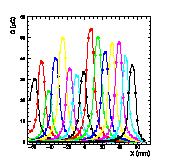
| Plot of all X and Y channels X1-X15 and Y1-Y15. The strips at negative x seem to have less response and that might be an indication of radiation damage since the beam pipe was on the left side of the detector (see XY section on top of the page). |
|
|
|
| Sunday Jan/28/2001: | ||
|
HV trimming was performed using the
power law curves as extracted from LED tests. We decided to
check the quality of the trimming by doing a quick
scan along X and Y with (T1.and.T2.and.T3) 5000 events/run
shooting at the center of the strips (as found by the previous
detailed and slow scan). This quick method fails close to the
detector boundaries. We plan to do a better trimming quality
check on Monday/Tuesday.
|
|
| |
|
|
|
| Monday Jan/29/2001: |
|
BPCn response and Energy Resolution after HV trimming.
Now the constant term is reduced to 2-3% and the fit
is in agreement (if not better) to the 1995 test beam
data (see Surrow's Thesis pg.161). EGS4 simulations show
a 16.0% sampling and 0.8% constant term.
| |
|
|
|
| Monday Jan/29/2001: |
|
Linear fit and residuals after trimming.
| |
|
|
|
| Wednesday Jan/31/2001: |
|
BPCs response and Energy Resolution using HV settings
as obtained from LED tests in the lab. These results can be
directly compared to the previous BPCs 1995 beam test.
The resolution fit leads to very similar values to the ones
obtained in 1995 with a 5 point fit (half the energy range).
We will perform a HV trimming and reevaluate the resolution.
| |
|
|
|
| Wednesday Jan/31/2001: |
|
Linear fit and residuals for initial HV (LED based) guess.
| |
|
|
|
| Wednesday Jan/31/2001: |
|
First BPCs results show a quite uniform response of
the channels we modified (and more uniform as
compared to BPCn).
| |
BPCs Modified channel response
|
| Saturday Feb/2/2001: |
| Plot of all X and Y channels X1-X11 and Y1-Y16. Notice that the BPCs was positioned in the way it will be positioned in the tunnel. This means that when we scan along Y we are looking at channels X1-X11 while a scan along X means channels Y1-Y16. Again the 16 Y channels are the ones we rebuilt. |
|

|
|
| Sunday Feb/3/2001: | ||
|
HV trimming was performed using the
power law curves as extracted from LED tests.
The RMS of the response is just 1.5% for the
channels we modified (Y). For the X channels the
RMS is 1%. For the actual values look below.
|
|
| |
|
|
|
| Sunday Feb/3/2001: | ||
|
The following file contains the actual values of
the gains of all channels after trimming.
|
|
Gain Values.
| |