| Category (in SR) | Electron Channel | Muon Channel |
|---|---|---|
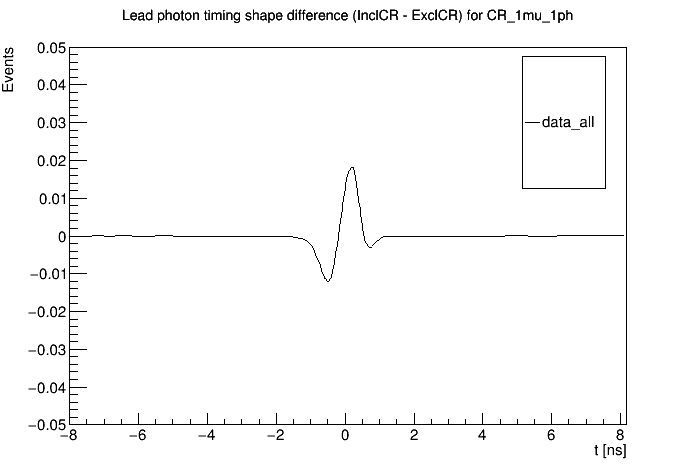
| Lepton(s): 1, Photon(s): 1 | 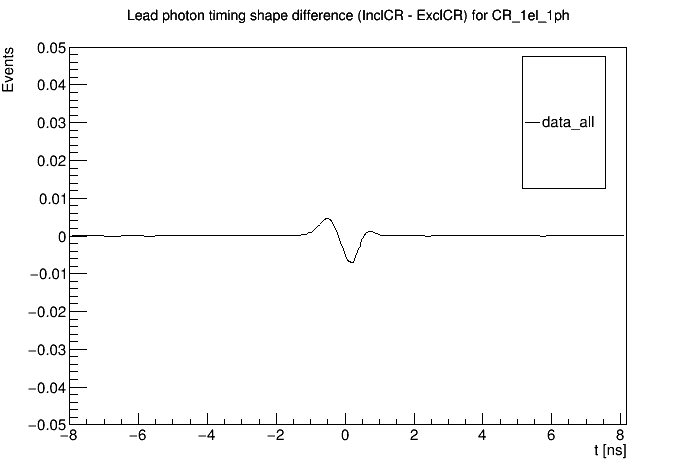 |
 |
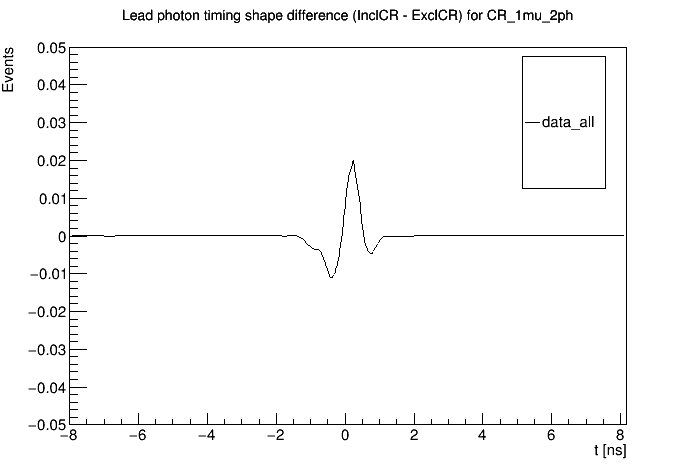
| Lepton(s): 1, Photon(s): 2 | 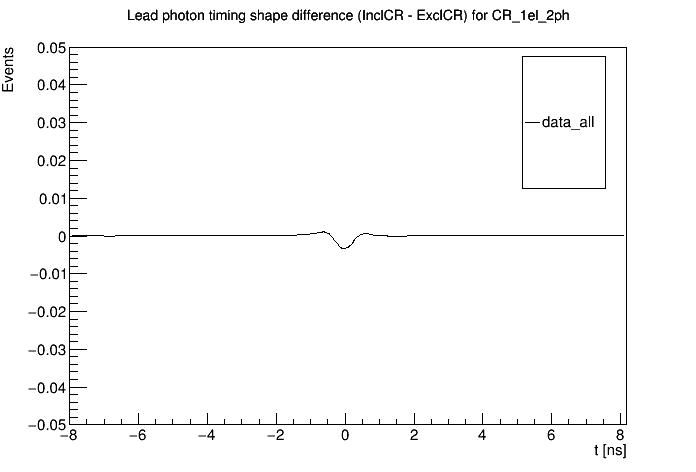 |
 |
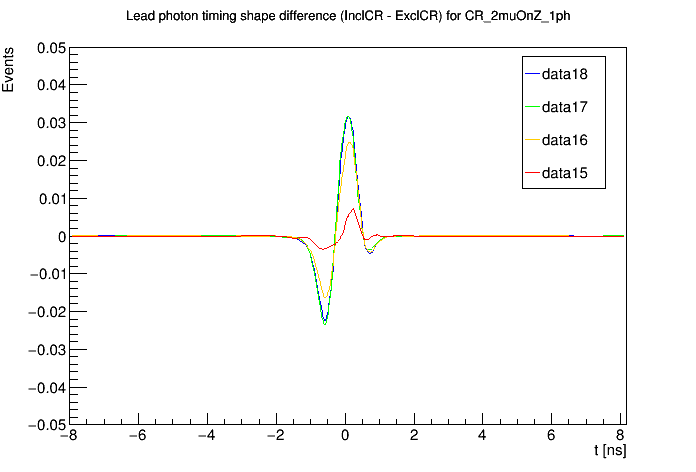
| Lepton(s): 2OnZ, Photon(s): 1 |  |
 |
| Lepton(s): 2OnZ, Photon(s): 2 |  |
 |
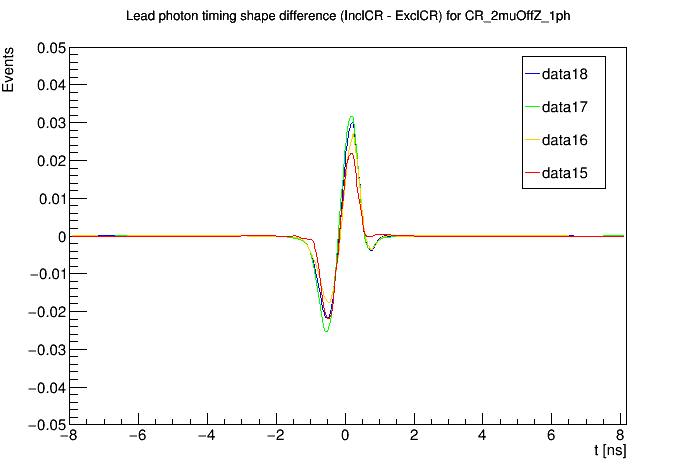
| Lepton(s): 2OffZ, Photon(s): 1 |  |
 |
| Lepton(s): 2OffZ, Photon(s): 2 |  |
 |
| Category (in SR) | Electron Channel | Muon Channel |
|---|---|---|
| Lepton(s): 1, Photon(s): 1 |  |
 |
| Lepton(s): 1, Photon(s): 2 |  |
 |
| Lepton(s): 2OnZ, Photon(s): 1 |  |
 |
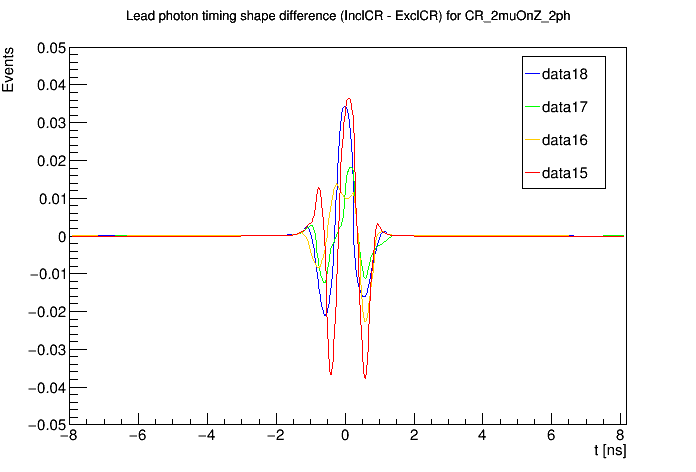
| Lepton(s): 2OnZ, Photon(s): 2 | 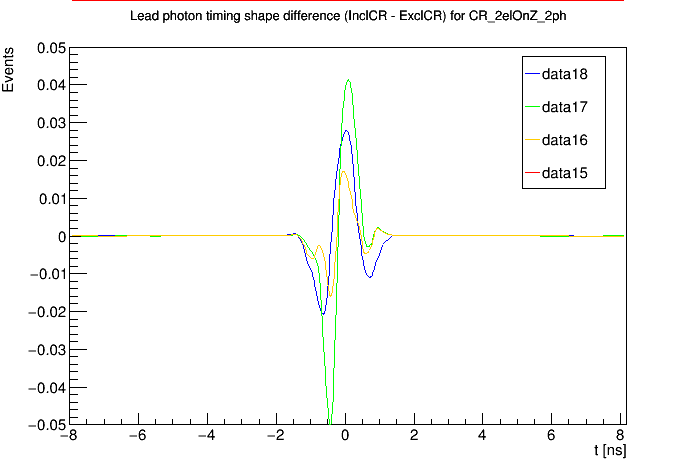 |
 |
| Lepton(s): 2OffZ, Photon(s): 1 | 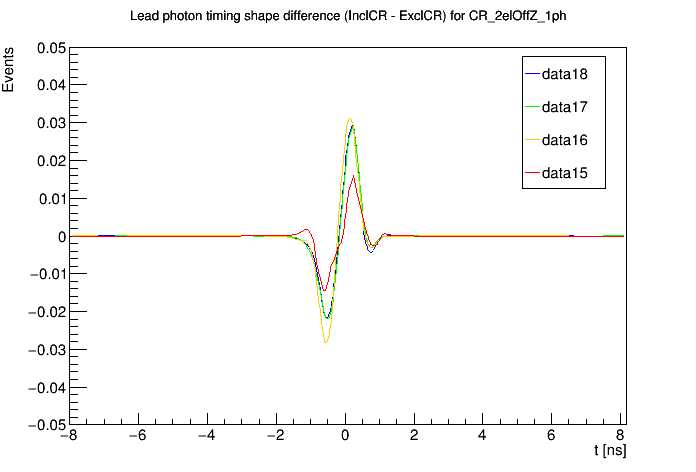 |
 |
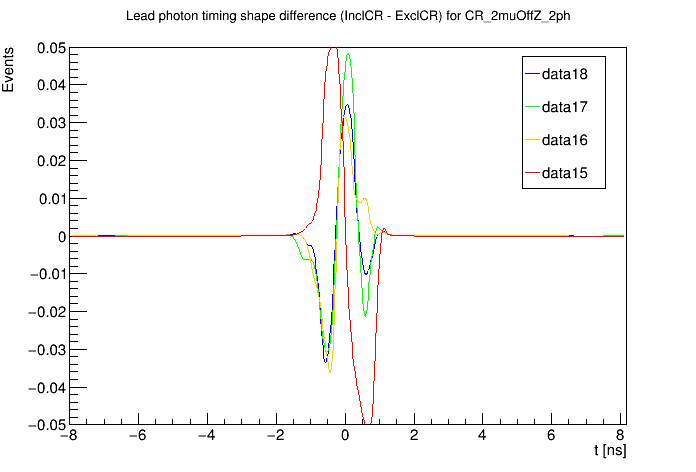
| Lepton(s): 2OffZ, Photon(s): 2 | 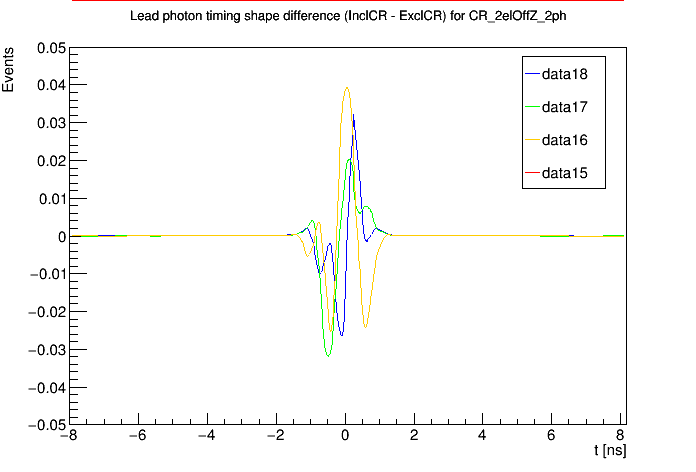 |
 |