| Tight, Unconverted Photons |
|---|
| Description | R1 | R2 |
|---|---|---|
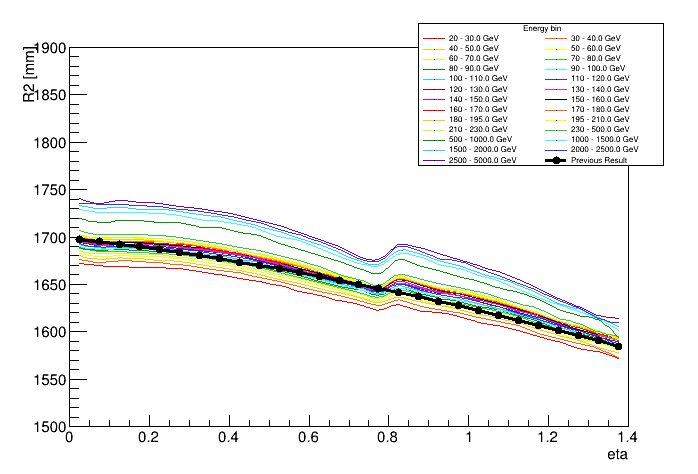
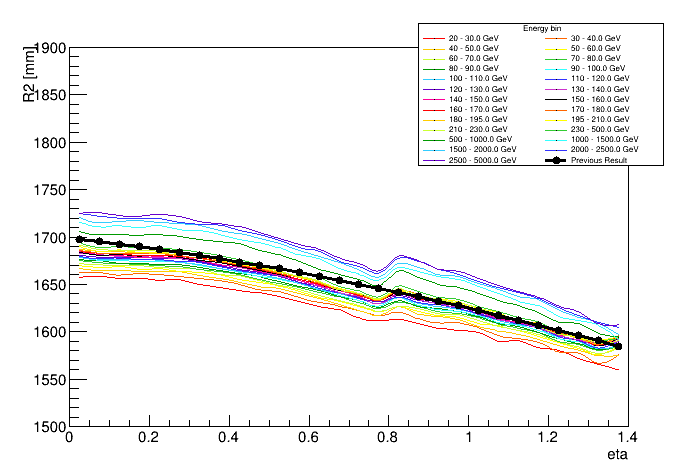
| Shower depth R vs eta | 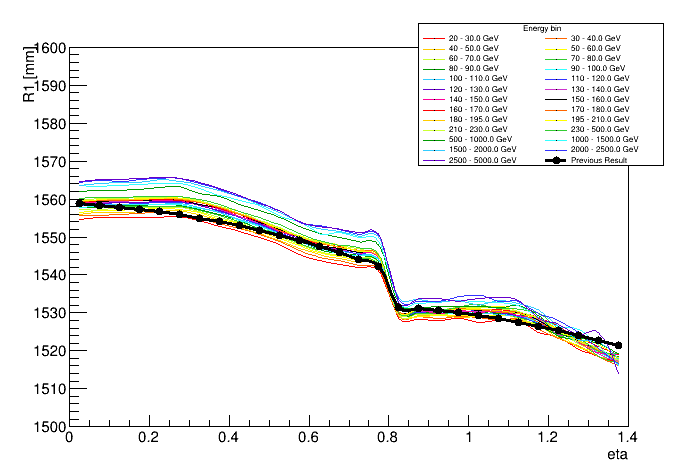 |
 |
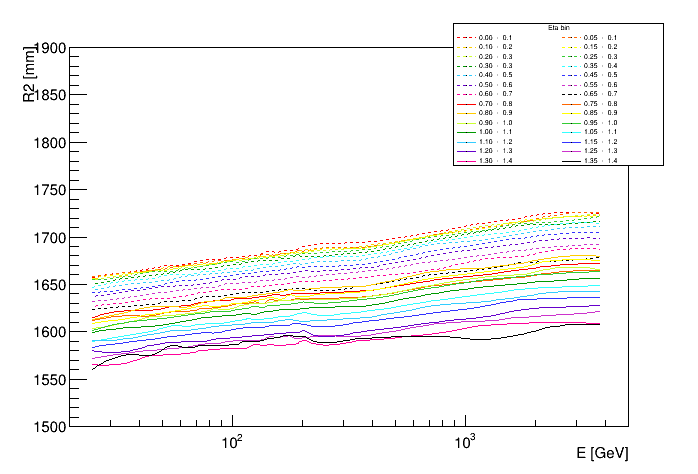
| Shower depth R vs Energy | 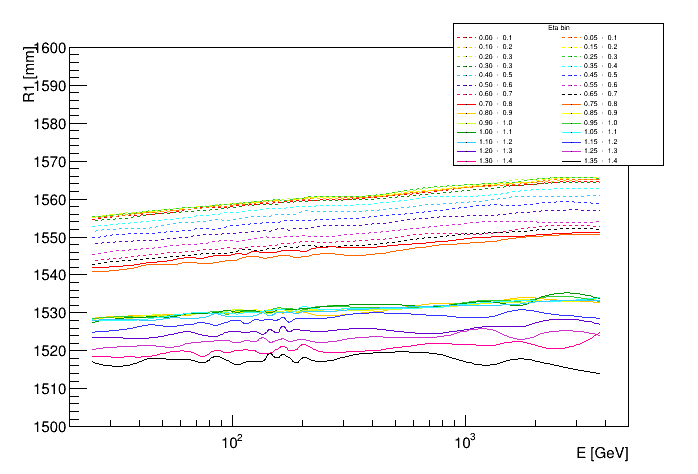 |
 |
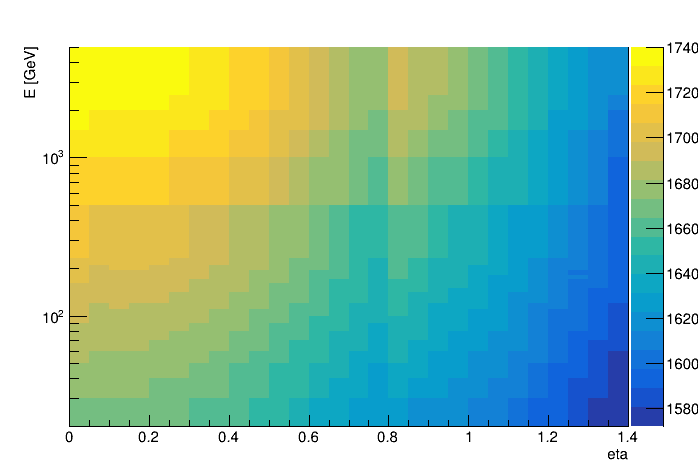
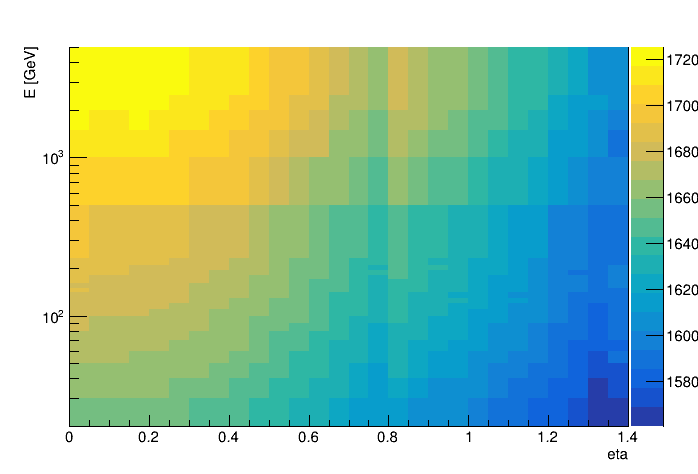
| Shower depth R vs eta and energy | 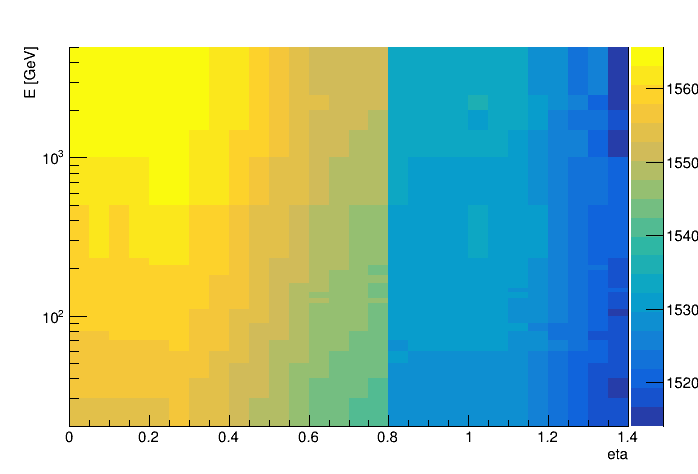 |
 |
| Number of events per eta and energy bin | 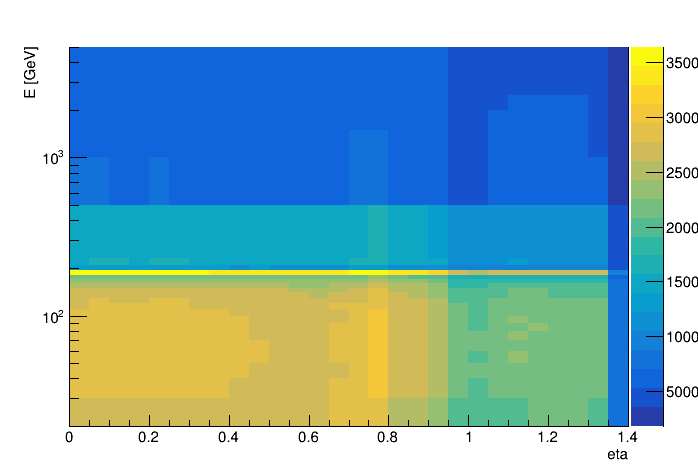 |
 |
| Tight, Converted Photons |
|---|
| Description | R1 | R2 |
|---|---|---|
| Shower depth R vs eta | 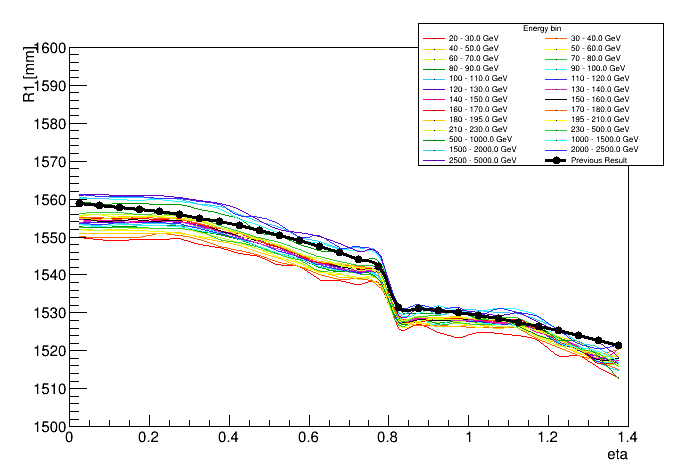 |
 |
| Shower depth R vs Energy | 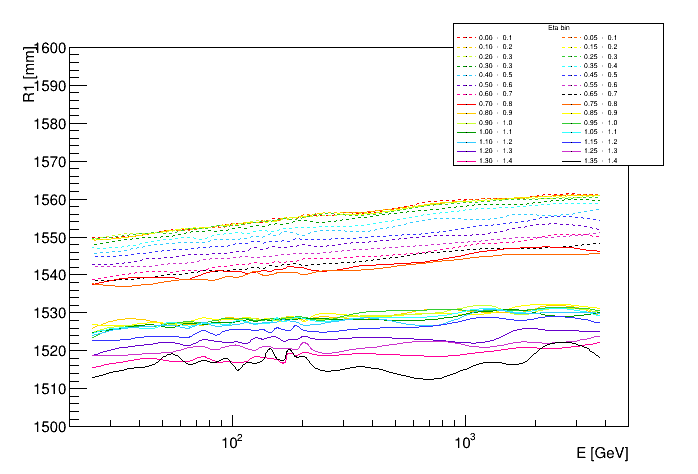 |
|
| Shower depth R vs eta and energy | 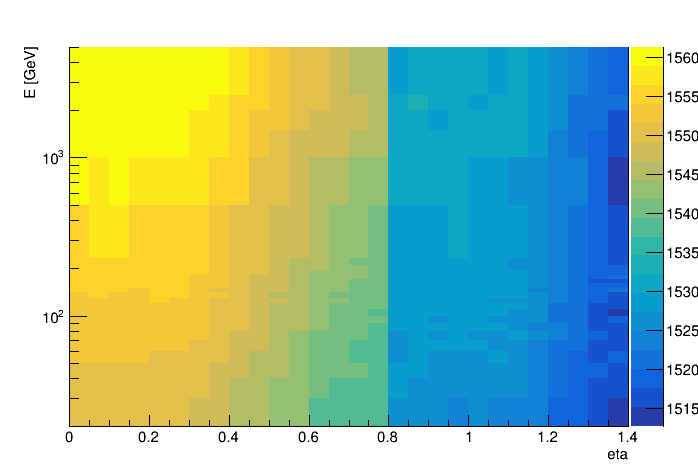 |
 |
| Number of events per eta and energy bin | 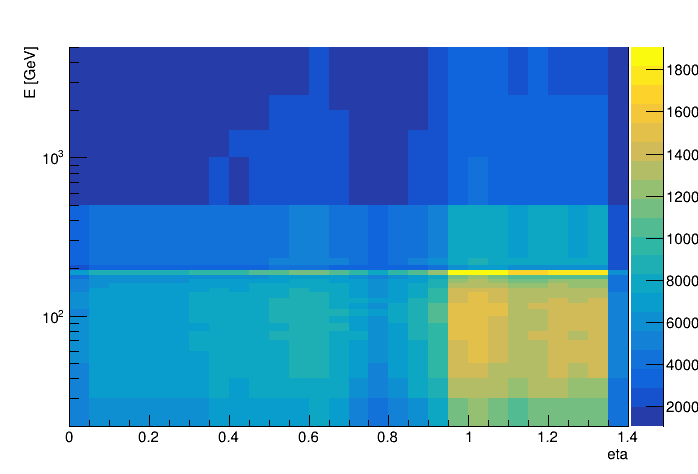 |
 |
| Geometric Method: A Visualization | |
|---|---|
| Calculate R1 and R2 for each event based on TV, etaTruth, and the eta of the barycenters (in red) | 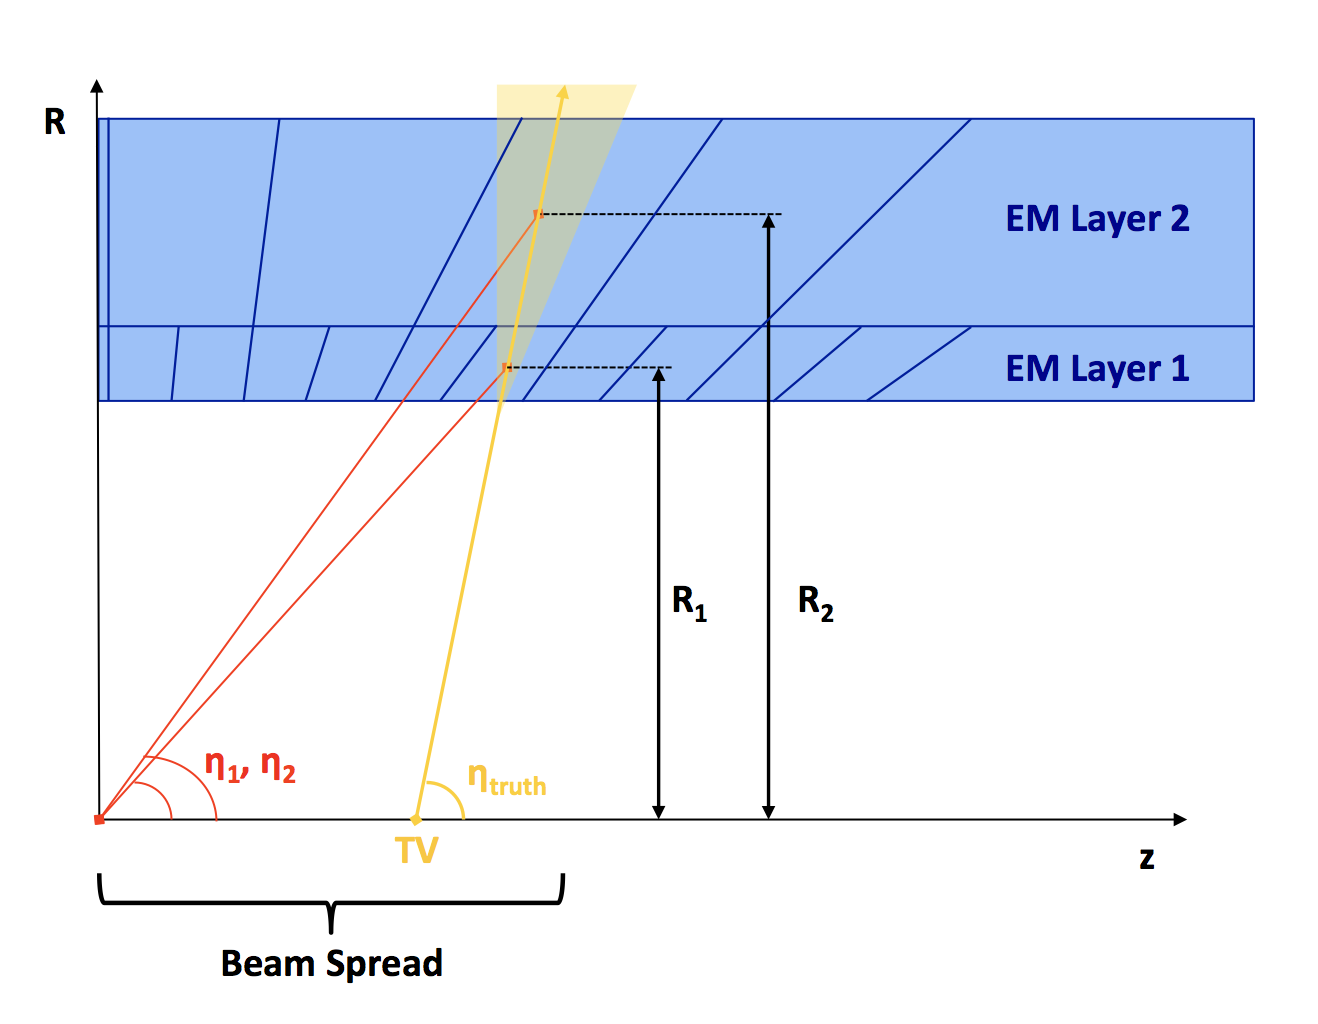 |