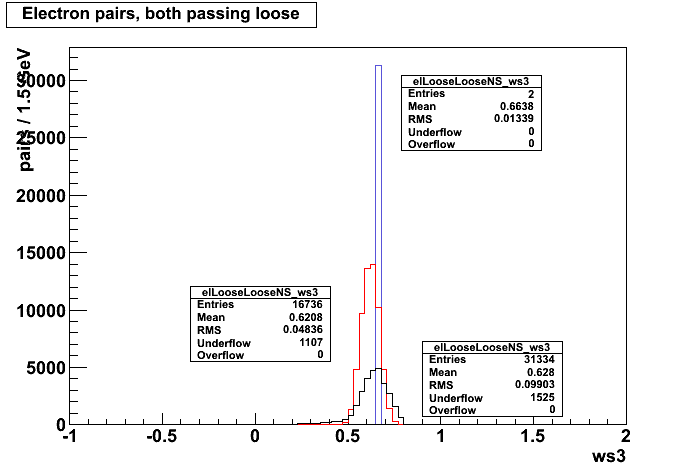
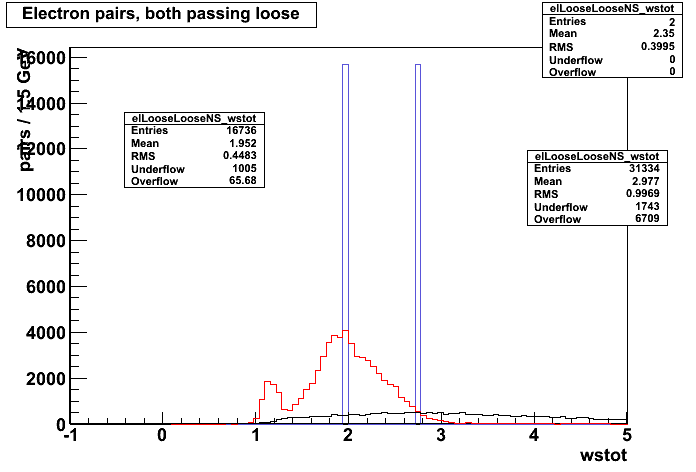
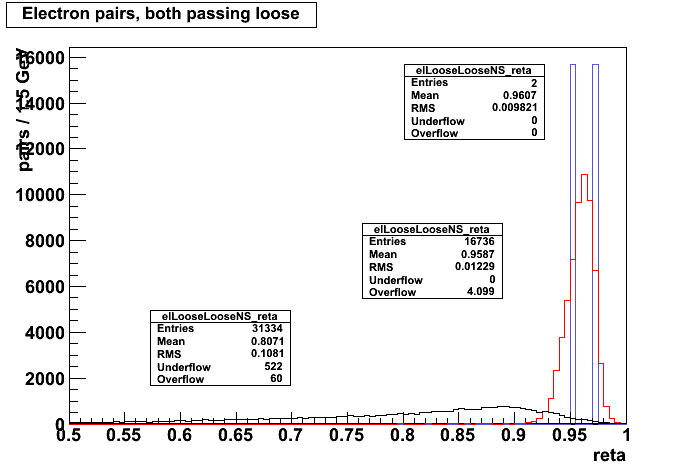
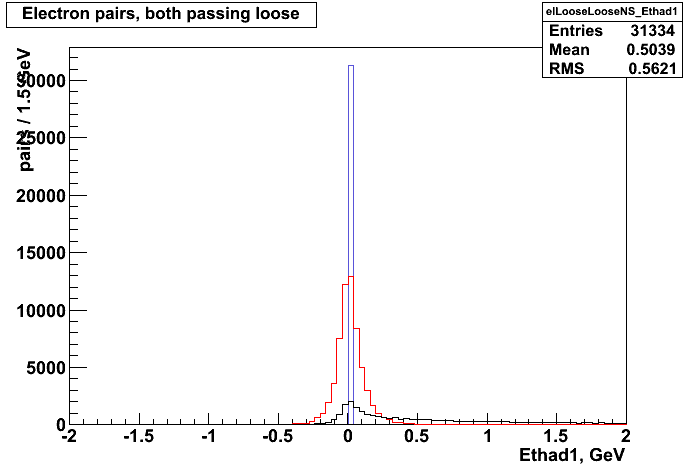
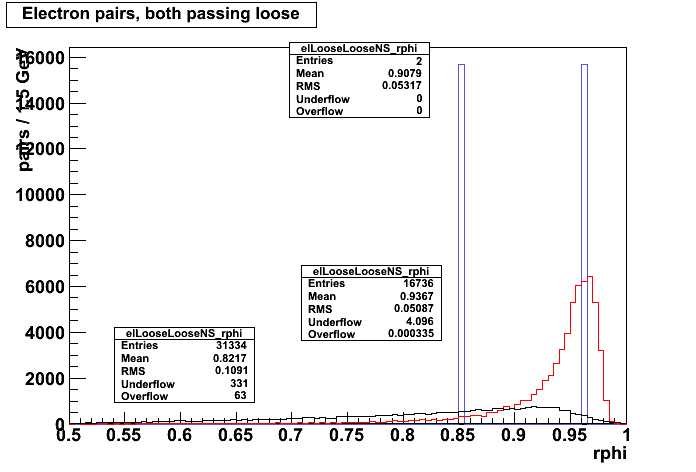
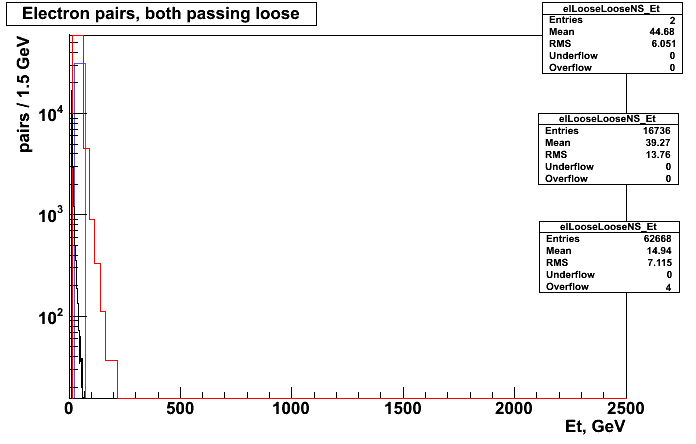
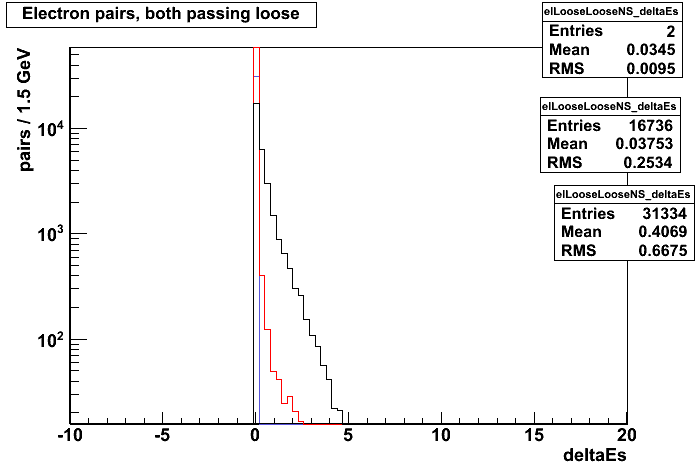
Normalized Histograms containing real anti-loose background, Monte Carlo simulation data as well as real data passing the LooseLoose cut.