Transformations and Actions
(15 minutes)
Let’s refine our understanding of what goes on when we perform
operations with RDataFrame.
In all of the examples I’ve given you up to now, I’ve shown each operation on a single line of code; e.g.,
// Define the dataframe from an input ntuple and file.
auto dataframe = ROOT::RDataFrame("tree1","experiment.root");

// Histogram the value of pt for pz<145 GeV, pt<10 GeV.
auto pzcut = dataframe.Filter("pz < 145");
auto ptdefine = pzcut.Define("pt","sqrt(px*px + py*py)");
auto ptcut = ptdefine.Filter("pt < 10");
auto pthist = ptcut.Histo1D("pt");
You can be much less verbose if you don’t need to use intermediate modified dataframes for anything:1
// Define the dataframe from an input ntuple and file.
auto dataframe = ROOT::RDataFrame("tree1","experiment.root");

// Histogram the value of pt for pz<145 GeV, pt<10 GeV.
auto pthist = dataframe.Filter("pz<145").Define("pt","sqrt(px*px+py*py)")
                       .Filter("pt<10").Histo1D("pt");
There’s an important restriction when you’re being more concise: You can
have as many transformations as you like on an RDataFrame, but a given sequence of
operations can have only one action.
Before I give you a definition of “transformation” or “action”, let me show you what led me to make this distinction. I tried to do something like this:
# Define the dataframe from an input ntuple and file.
import ROOT
dataframe = ROOT.RDataFrame("tree1","experiment.root")

# Count the number of events with pz<145 GeV and histogram them.
pthist = dataframe.Filter("pz < 145").Count().Histo1D("pz")
The above line won’t work; give it a try to see the error message.2
The reason why the code doesn’t work is that both Count() and Histo1D()
are actions. A transformation like Define() or Filter() changes the
n-tuple; an action accumulates data within the n-tuple. If you go
to the RDataFrame web page,
you will see lists of which RDataFrame operations are transformations and
which are actions (and which are queries, yet another category).
Here’s a re-write of the code above so that there’s only one action per line.
# Define the dataframe from an input ntuple and file.
import ROOT
dataframe = ROOT.RDataFrame("tree1","experiment.root")

# Count the number of events with pz<145 GeV and histogram them.
ptcut = dataframe.Filter("pz < 145")
ptcount = ptcut.Count()
pthist = ptcut.Histo1D("pz")
In other words, you can put everything on one line if you don’t need to use the intermediate modified dataframes. If you want to apply more than one action to same modified dataframe, then you will have to create intermediate dataframe variables.
Tip
Some folks may find a diagram helpful for understanding this idea. Consider the following code:3
// Define an RDataFrame.
auto dataframe = ROOT::RDataFrame("tree1","experiment.root");

// Create a couple of histograms, before and after a pz cut.
// Make sure the x-axes of the plots will be the same.
auto pzhist = dataframe.Histo1D({"pz","pz before cut",100,130,170},"pz");
auto pzcuthist = dataframe.Filter("pz < 145")
                     .Histo1D({"pzcut","pz after cut",100,130,170},"pz");

// Create a new column, pt, and look at chi2 before and after a pt cut.
// Again, make sure the x-axes match on the histograms.
auto ptDefined = dataframe.Define("pt","sqrt(px*px + py*py)");
auto chi2hist = ptDefined
              .Histo1D({"chi2","chi2 before cut",100,0,20},"chi2");
auto chi2cut = ptDefined.Filter("pt < 10");
auto chi2cuthist = chi2cut
              .Histo1D({"chi2cut","chi2 after cut",100,0,20},"chi2");

// How many events passed our pt cut?
auto chi2cutcount = chi2cut.Count();

// The necessary Draw() and GetValue() methods to see any plots or values
// are left as an exercise for the student.
This is a diagram of how RDataFrame organizes the chain of operations to be
performed on the n-tuple:
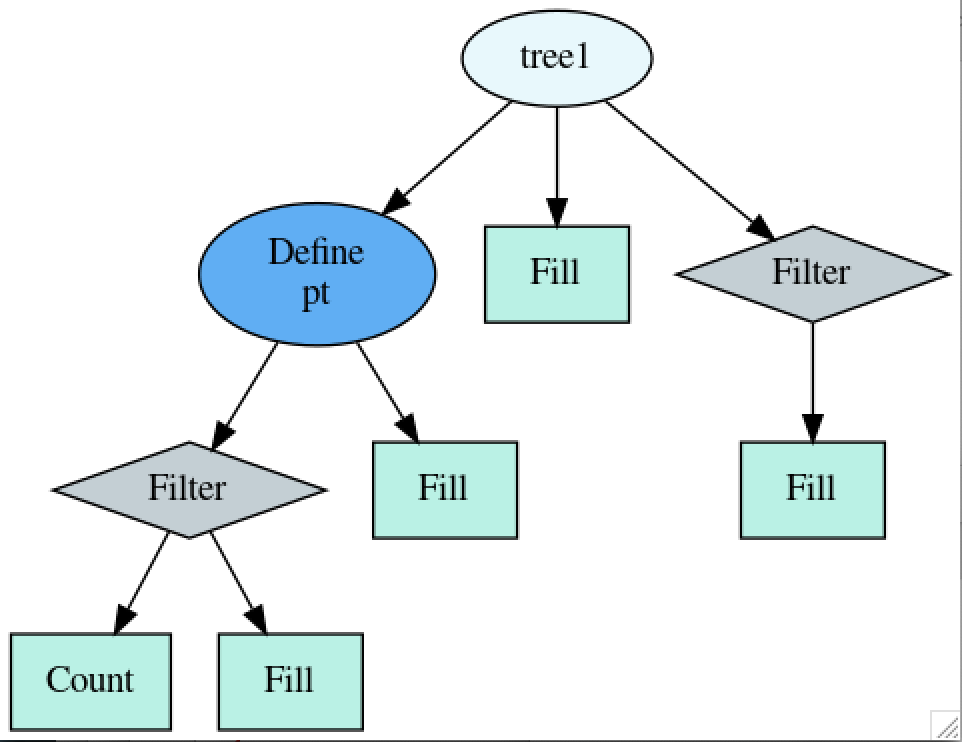
Figure 54: The series of operations that have been assigned to the tree1 n-tuple
based on the above code.
You may want to look at the program listing and match it against the operations indicated in the diagram. For a “path of operations” to take place, that path must end in an action, which are the rectangles in the diagram.4
- 1
If you’re using Python, it might help to note that C++ does not need anything special to continue a program statement on another line (it’s the
;that terminates a statement). Python requires a backslash\to continue a statement onto the next line.- 2
If you’re a C++ snob (which I’ve been accused of being from time to time), you might foolishly assume that it doesn’t work because the code is in Python. Instead of being rude, just slap an
autoin the front and a;at the end and see for yourself.- 3
If the stuff in the curly braces
{}is confusing to you, look at the footnotes in Walkthrough: Making scatterplots.- 4
You can generate a diagram like this for your own dataframes, but it can be a lot of additional work. I only recommend it if you find these kinds of diagrams to be useful.
Here’s how I made that diagram using the
SaveGraphmethod that’s part ofRDataFrame. After I defined all my n-tuple operations, I executed:// C++ ROOT::RDF::SaveGraph(dataframe, "./dataframe.dot"); // Python ROOT.ROOT.RDF.SaveGraph(dataframe, "./dataframe.dot")
This will create a file
dataframe.dotin your current directory. You can look at the file using less, but all you’ll see is a text representation of the graph.To turn a
.dotfile into a diagram, you need to have the Graphviz software installed; this is available on all the systems on the Nevis particle-physics Linux cluster. The Nevis systems also have ImageMagick; all you have to do on a system with both is type this in your UNIX window:display dataframe.dot
If you’re not on a Nevis system, see Installing ROOT on your own computer and include
graphvizandimagemagickwhen you installroot.