Exercise 2: Add error bars to a histogram
(5 minutes)
We’re still plotting the chi2 histogram as a solid curve. Most of
the time, your supervisor will want to see histograms with errors.
Revise the line in the Warp-up section to draw the
histograms with error bars.
Hint
Look back at Working with Histograms.
Look carefully
The histogram may not be immediately visible, because all the points are squeezed into the left-hand side of the plot. We’ll investigate the reason why in a subsequent exercise.
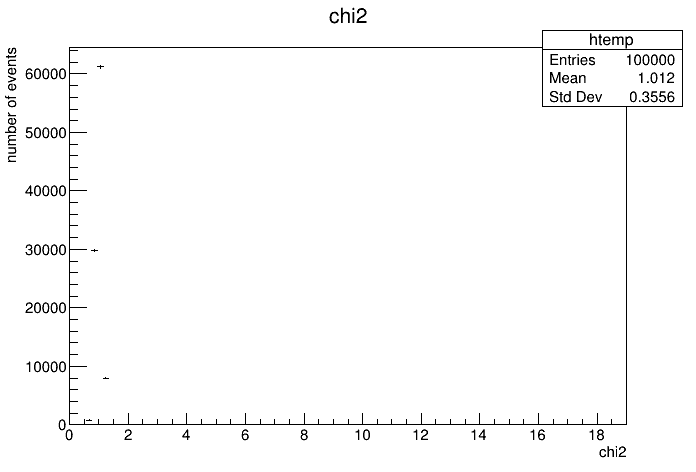
Figure 30: What I get when I plot chi2 with errors bars turned on.
This plot required special handling
See this note in the Python tutorial for how I made this plot.