Exercise 13: A more realistic x-y plotting task (1-2 hours)
Note
It took several pages to set up the previous exercise. It only takes one page to describe this one. Don’t be fooled: this exercise is harder!
Take a look at folder example2 in folders.root. You’ll see histograms
and an n-tuple named histogramList. Right-click on histogramList and Scan
the n-tuple. On the ROOT text window, you’ll see that the n-tuple is a
list of histogram ID numbers and an associated value.
Once again, you’re going to fit all those histograms to a gaussian and make an x-y plot. The y values and error bars will come from the fits, as in the previous exercise. The x values will come from the n-tuple; for example, the value of x for histogram ID 14 is 1.0122363.
I’ll let you pick the axis labels for this graph; don’t make the x-axis logarithmic.

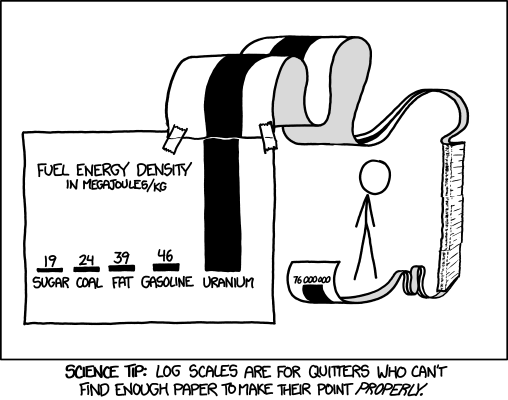
Figure 48: https://xkcd.com/1162/ by Randall Munroe
Note
You’ve probably already figured out that you can use MakeSelector on the
histogramList n-tuple, like you did before.
The challenge will be putting together the code inside the Process
method of the new class with code from the previous exercise.
In the previous exercise, perhaps you hard-coded the number of histograms in the folder. Don’t do that here. You could get the number of histograms from the number of entries in the n-tuple.
Or maybe that’s not a good idea; what if there were an entry in the n-tuple but no corresponding histogram? Keep a separate count of the number of “valid” histograms you’re able to read. This means you’ll have to check if you’ve read each histogram correctly. C++ tip: If a ROOT operation to read a pointer fails, that pointer will be set to NULL.