# Exercise 13: A more realistic x-y plotting task
**(1-2 hours)**
:::{admonition} It's not as easy as it looks
:class: note
It took several pages to set up the previous exercise. It only takes one
page to describe this one. Don't be fooled: this exercise is harder!
:::
Take a look at folder `example2` in {file}`folders.root`. You'll see histograms
and an n-tuple named `histogramList`. Right-click on `histogramList` and **Scan**
the n-tuple. On the ROOT text window, you'll see that the n-tuple is a
list of histogram ID numbers and an associated value.
Once again, you're going to fit all those histograms to a Gaussian and
make an x-y plot. The y values and error bars will come from the fits,
as in the previous exercise. The x values will come from the n-tuple; for
example, the value of x for histogram ID 14 is 1.0122363.
I'll let you pick the axis labels for this graph; don't make the x-axis
logarithmic.
:::{figure-md} log_scale-fig
:class: align-center
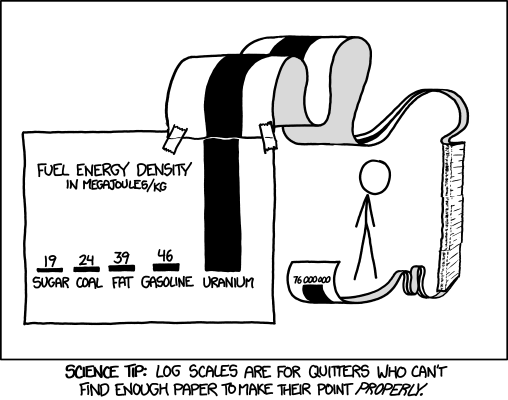
 by Randall Munroe
:::
:::{admonition} Getting started
:class: note
You can use `MakeSelector` on the
`histogramList` n-tuple, like you may have done {ref}`before `.
The challenge will be putting together the code inside the `Process`
method of the new class with code from the previous exercise.
In the previous exercise, perhaps you hard-coded the number of
histograms in the folder. Don't do that here. You could get the number
of histograms from the number of entries in the n-tuple.
Or maybe that's not a good idea; what if there were an entry in the
n-tuple but no corresponding histogram? Keep a separate count of the
number of "valid" histograms you're able to read. This means you'll have
to check if you've read each histogram correctly. C++ tip: If a ROOT
operation to read a pointer fails, that pointer will be {ref}`set to nullptr `.
:::
