# "We're looking for a five-sigma effect"
Suppose after a long and detailed physics analysis, you finally have a
result. Assume it's in the form of a measurement and its associated
error.[^f125] Let's further assume that there's a null hypothesis
associated with this measurement: If a particular property did not
exist, the measurement would have been different.
:::{figure-md} null_hypothesis-fig
:class: align-center
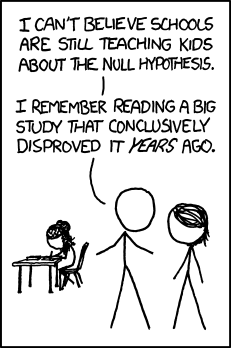 by Randall Munroe
:::
When physicists consider such a measurement, they ask the question: What
is the probability is that their measurement is consistent with the null
hypothesis; that is, what are the chances that the null hypothesis is
correct, and that their measurement is just a random statistical
fluctuation?
Let's take another look at our friend, the Gaussian function. As a
probability density function, it indicates the likelihood of a particular
measurement being different from the actual underlying value.
:::{figure-md} normal-distribution-fig
:class: align-center
by Randall Munroe
:::
When physicists consider such a measurement, they ask the question: What
is the probability is that their measurement is consistent with the null
hypothesis; that is, what are the chances that the null hypothesis is
correct, and that their measurement is just a random statistical
fluctuation?
Let's take another look at our friend, the Gaussian function. As a
probability density function, it indicates the likelihood of a particular
measurement being different from the actual underlying value.
:::{figure-md} normal-distribution-fig
:class: align-center
 A plot of the normal distribution where each band has a width
of 1 standard deviation.
Source: M. W. Toews,
under the CC-by-4.0 license
:::
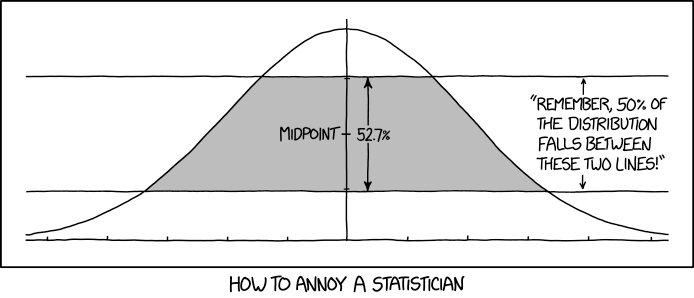
Think about this in the context of the following cartoon. The
scientists perform 20 tests each with a significance at the 5% level.
You'd expect that one of the tests would randomly be far enough from the
"mean of the normal distribution" that you'd get an anomalous result.
Physicists often can't perform multiple measurements of a given
quantity,[^f126] so they look at their results in a different way.
:::{figure-md} significant-fig
:align: center
A plot of the normal distribution where each band has a width
of 1 standard deviation.
Source: M. W. Toews,
under the CC-by-4.0 license
:::
Think about this in the context of the following cartoon. The
scientists perform 20 tests each with a significance at the 5% level.
You'd expect that one of the tests would randomly be far enough from the
"mean of the normal distribution" that you'd get an anomalous result.
Physicists often can't perform multiple measurements of a given
quantity,[^f126] so they look at their results in a different way.
:::{figure-md} significant-fig
:align: center
 by Randall Munroe
:::
When physicists express a measurement versus a null hypothesis, they
usually state it in terms of "sigma" or the number of standard
deviations that it is from that hypothesis. This is how I think of
it, even though they don't usually show it in this way:
:::{figure-md} my-null-hypothesis-fig
:class: align-center
by Randall Munroe
:::
When physicists express a measurement versus a null hypothesis, they
usually state it in terms of "sigma" or the number of standard
deviations that it is from that hypothesis. This is how I think of
it, even though they don't usually show it in this way:
:::{figure-md} my-null-hypothesis-fig
:class: align-center
 What I picture when a physicist says they've observed an
effect at more than a 5$\sigma$ level of significance.
:::
In this
imaginary experiment, the result is reported at 22.01 ± 3.52 *WeV*. I
picture a normal distribution with a mean of 22.01 and
$\sigma$=3.52 superimposed on the measurement. Then I count off
the number of sigmas between the mean and the null hypothesis. In this
particular imaginary experiment, the difference is more than
5$\sigma$ and therefore refutes the null hypothesis. Hence the
P particle exists!
In other words, I imagine an assumption that the same normal
distribution applies to the null hypothesis (the dashed curve) and ask
if what we actually observed could be within 5$\sigma$ of the
mean of the null hypothesis.
At this point, you may have compared {numref}`Figure %s
` and {numref}`Figure %s
`, including the captions, and thought, "Wait
a second. A 3$\sigma$ effect would mean that the odds that the null
hypothesis was correct would be something like 0.1%, right? In fact, I
just looked it up, and the exact value is closer to 0.3%. Isn't that
good enough? It's much better than that xkcd cartoon. Why do
physicists insist on a 5$\sigma$ effect, which is around 0.00003% or
one in 3.5 million?"
A 3$\sigma$ effect is indeed only considered "evidence," while a
5$\sigma$ effect is necessary for a "discovery." The reason why is
summarized in a quote from a colleague on my thesis experiment: "We see
3$\sigma$ effects go away all the time."
The reason why 3$\sigma$ effects "go away" is a deeper study of the data
and its analysis procedure. One potential cause of such a shift is a
change in systematic bias as you work to understand your {ref}`systematic errors`.
:::{figure-md} normal_distribution-fig
:class: align-center
What I picture when a physicist says they've observed an
effect at more than a 5$\sigma$ level of significance.
:::
In this
imaginary experiment, the result is reported at 22.01 ± 3.52 *WeV*. I
picture a normal distribution with a mean of 22.01 and
$\sigma$=3.52 superimposed on the measurement. Then I count off
the number of sigmas between the mean and the null hypothesis. In this
particular imaginary experiment, the difference is more than
5$\sigma$ and therefore refutes the null hypothesis. Hence the
P particle exists!
In other words, I imagine an assumption that the same normal
distribution applies to the null hypothesis (the dashed curve) and ask
if what we actually observed could be within 5$\sigma$ of the
mean of the null hypothesis.
At this point, you may have compared {numref}`Figure %s
` and {numref}`Figure %s
`, including the captions, and thought, "Wait
a second. A 3$\sigma$ effect would mean that the odds that the null
hypothesis was correct would be something like 0.1%, right? In fact, I
just looked it up, and the exact value is closer to 0.3%. Isn't that
good enough? It's much better than that xkcd cartoon. Why do
physicists insist on a 5$\sigma$ effect, which is around 0.00003% or
one in 3.5 million?"
A 3$\sigma$ effect is indeed only considered "evidence," while a
5$\sigma$ effect is necessary for a "discovery." The reason why is
summarized in a quote from a colleague on my thesis experiment: "We see
3$\sigma$ effects go away all the time."
The reason why 3$\sigma$ effects "go away" is a deeper study of the data
and its analysis procedure. One potential cause of such a shift is a
change in systematic bias as you work to understand your {ref}`systematic errors`.
:::{figure-md} normal_distribution-fig
:class: align-center
 by Randall Munroe
:::
[^f125]: As you'll learn in the section on {ref}`systematic errors`,
the errors are the tough part.
[^f126]: The Large Hadron Collider at CERN costs about $9 billion. It's
obvious that they should build 100 similar nine-mile-wide particle
colliders so we can make multiple independent measurements of the
Higgs boson mass. Why they haven't is completely beyond me.
by Randall Munroe
:::
[^f125]: As you'll learn in the section on {ref}`systematic errors`,
the errors are the tough part.
[^f126]: The Large Hadron Collider at CERN costs about $9 billion. It's
obvious that they should build 100 similar nine-mile-wide particle
colliders so we can make multiple independent measurements of the
Higgs boson mass. Why they haven't is completely beyond me.