# Poisson distributions
Let's take a brief look at one alternative distribution since it will
come up later: the Poisson distribution, which models the number of
discrete events seen in an interval of time or space; for example,
radioactive decay. It's given by:
:::{math}
:label: eqn:poisson
P(k;\lambda) = \frac{\lambda^{k}e^{- \lambda}}{k!}
:::
where:
- $k$ is the number of occurrences you might measure in an interval,
- $\lambda$ is the mean number of events you'd expect see per interval,
- $P(k;\lambda)$ is the probability of seeing $k$ events given a mean
of $\lambda$.
This plot may help you visualize what's going on:
:::{figure-md} poisson-distributions-fig
:class: align-center
 Examples of Poisson distributions for a few values of
$\lambda$. Source:
Skbkekas
under the CC BY 3.0 license
:::
For example, if you're running an experiment whose observations follow
a Poisson distribution, and the mean number of events you'd expect to
see is $\lambda$=4, then the probability of seeing exactly 4 events in
the interval is about 0.20.
You may have noticed that for $\lambda$=10, the curve looks like a
Gaussian. In fact, a Gaussian can be defined as the limit for large
$\lambda$ of a Poisson distribution.[^f113]
As it happens, the particle-physics experiments that I've worked on have
typically involved tens to hundreds of thousands of events, even after
applying cuts,[^f114] so I've usually worked with Gaussian probability
distributions. If you're working on an experiment with infrequent events
in space or time, then you'll become more familiar with the Poisson
distribution.
Let's keep that in mind as we move on to discussing fitting a function
to data {ref}`in the next section `.
:::{figure-md} poisson-fig
:class: align-center
Examples of Poisson distributions for a few values of
$\lambda$. Source:
Skbkekas
under the CC BY 3.0 license
:::
For example, if you're running an experiment whose observations follow
a Poisson distribution, and the mean number of events you'd expect to
see is $\lambda$=4, then the probability of seeing exactly 4 events in
the interval is about 0.20.
You may have noticed that for $\lambda$=10, the curve looks like a
Gaussian. In fact, a Gaussian can be defined as the limit for large
$\lambda$ of a Poisson distribution.[^f113]
As it happens, the particle-physics experiments that I've worked on have
typically involved tens to hundreds of thousands of events, even after
applying cuts,[^f114] so I've usually worked with Gaussian probability
distributions. If you're working on an experiment with infrequent events
in space or time, then you'll become more familiar with the Poisson
distribution.
Let's keep that in mind as we move on to discussing fitting a function
to data {ref}`in the next section `.
:::{figure-md} poisson-fig
:class: align-center
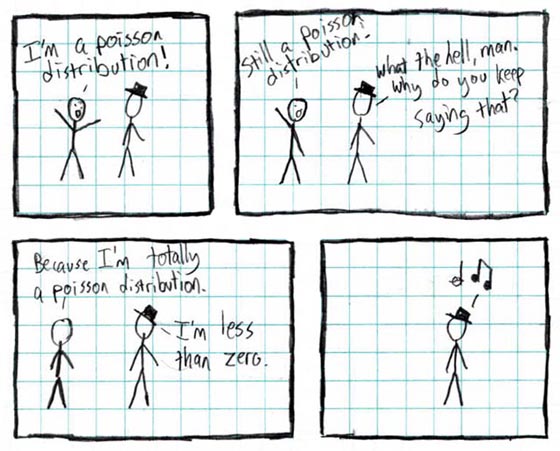 by Randall Munroe.
This early xkcd cartoon is more subtle than usual. If you're having trouble
figuring it out, take another look at the above equation and plot.
:::
[^f113]: Why is it a "Gaussian" distribution (making an adjective from
the name [Carl Friedrich
Gauss](https://www.britannica.com/biography/Carl-Friedrich-Gauss))
but a "Poisson" distribution (after [Siméon-Denis
Poisson](https://mathshistory.st-andrews.ac.uk/Biographies/Poisson/))
and not a "Poissonian" distribution? I'm a physicist, not a
language expert. I'll leave the answer as an exercise for the
student.
[^f114]: If you don't know what "applying a cut" means yet, you can read
{ref}`the RDataFrame explanation `,
{ref}`the Python explanation `, or
{ref}`the C++ explanation `.
by Randall Munroe.
This early xkcd cartoon is more subtle than usual. If you're having trouble
figuring it out, take another look at the above equation and plot.
:::
[^f113]: Why is it a "Gaussian" distribution (making an adjective from
the name [Carl Friedrich
Gauss](https://www.britannica.com/biography/Carl-Friedrich-Gauss))
but a "Poisson" distribution (after [Siméon-Denis
Poisson](https://mathshistory.st-andrews.ac.uk/Biographies/Poisson/))
and not a "Poissonian" distribution? I'm a physicist, not a
language expert. I'll leave the answer as an exercise for the
student.
[^f114]: If you don't know what "applying a cut" means yet, you can read
{ref}`the RDataFrame explanation `,
{ref}`the Python explanation `, or
{ref}`the C++ explanation `.