Exercise 12: Create a basic x-y plot
(1-2.5 hours)
You’re going to re-create that “pun plot” that I showed during my initial talk:1

Figure 82: Can you spot the pun in this plot? Hint: It involves the composer of a piece of music for piano and orchestra written in the early 20th century.
Use the histograms in folder example1 from the file folders.root. The
y-values and error bars will come from fitting each histogram to a
Gaussian distribution; the y-value is the mean of the Gaussian, and the
y-error is the width of the Gaussian.
A few more items…
You’ve scrolled through web pages reading about abstract concepts and are probably eager to do some work, but there’s still a couple of things you’ll have to figure out.
First of all, there’s no n-tuple in this exercise. You’ll have to create
a ROOT or pyroot macro to create the graph on your own.2 You’ve
seen some macros before (remember c1.C?) and you’ll find many more in
the ROOT tutorials.
You need to figure out how to get the x-values. In this case, it’s
relatively simple. There are only six histograms in the example1 folder.
In TBrowser, double-click on the histograms and read the titles. The
histograms are numbered from hist0 to hist5; you must derive a formula
to go from the histogram index to the value of x.
You already know how to open a ROOT file within a macro (it was part of
exercise 10), but it’s not obvious how to
“navigate” to a particular folder within a file. Look at the description
of the TFile class on the ROOT web site. Is there a method that looks
like it might get a directory?
Focus
By now, you’ve probably learned that for ROOT to know where to look to
plot, read, or write something, it has to know where to “focus.” If an
object requires focus in some way, it will have a cd() method (short for
“change directory”; remember Exercise 3?). Based on that
hint, and what you can see on the TFile web page, something like this
might work:
TDirectory* example1 = inputFile->GetDirectory("example1");
example1->cd();
The histograms are numbered 0 to 5 consecutively. It would be nice to write a loop to read in “hist0”, “hist1”, … “hist5” and fit each one. But to do that, you have to somehow convert a numeric value to a text string.
If you know C or C++, you already know ways to do this (and in Python it’s trivial). If all this is new to you, here’s one way to do it:
#include <sstream> // put this near the top of your macro

// Loop over all possible histogram numbers.
for ( int i = 0; i != 6; ++i )
{
    // Define an "output string stream" object; that is, a variable
    // that can be the output of C++-style I/O.
    std::ostringstream os;

    // Write the characters "hist" following by the number i
    // into the string stream.
    os << "hist" << i;

    // Extract the text string from the string stream and save
    // the result in a ROOT-style string.
    TString histogramName = os.str();

    // ... do what you need to with histogramName
}
There are other problems you’ll have to solve:
How do you read a histogram from a file? Or the more general question is: How do you get a ROOT object from a file?
Hint
How do you “find” an object in a
TFile? (Once you’ve figured this out, look through the tutorial files for more clues.)Once you fit a histogram to a Gaussian distribution, how do you get the mean and width of the Gaussian from the fit?
Hint
The
TH1page lists the method you’ll need.In Figure 82, the x-axis is logarithmic. How do you make that change?
Hint
Remember how you found out how to label an axis?
Speaking of axis labels, how do you put in \(\frac{n_{ions}}{d\left(Falla\right)}\)?
Hint
Look up
TLatexin the ROOT web site. You don’t have to declare aTLatexobject; just put the text codes into the axis label and ROOT will interpret them.How do you get the marker shapes and colors as shown in the plot?
Hint
There are hints in the x-y plots page.
Now you can get to work!
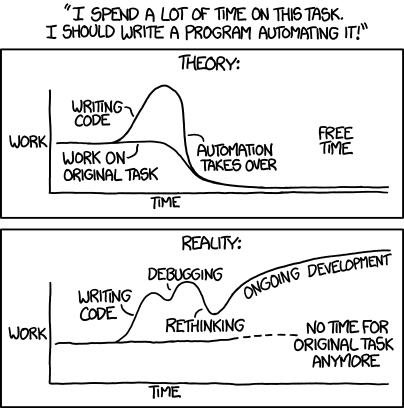
Figure 83: https://xkcd.com/1319/ by Randall Munroe
- 1
For Python programmers: if you use an appropriate routine from matplotlib, you’ll have to figure out how to get that mathematical formula to label the y-axis of the plot. This page may help you get LaTeX expressions into your axes labels.
- 2
Instead of creating a macro file, you could try typing the commands on the ROOT command line one-by-one. However, unless you have a shining grasp of ROOT concepts and perfect typing skills, you’re going to make mistakes that will involve many quit-and-restarts of ROOT. It’s much easier to write and edit a macro (or use a Jupyter notebook).