Walkthrough: Making Histograms
(10 minutes)
This tutorial is all about making histograms, so let’s use
RDataFrame to make a histogram. Here’s an example of making a
histogram of chi2 from the dataframe:
histchi2 = dataframe.Histo1D("chi2");
histchi2 = dataframe.Histo1D("chi2")
We’ve made the histogram. Now let’s draw it:
histchi2->Draw();
histchi2.Draw()
Give it a try!
What’s that? It didn’t work? It didn’t if you’re using a notebook.
I’m being sneaky: I counted on you to forget the bit about needing a canvas (either in C++ or Python). Here’s a more complete example:
TCanvas canvas;
histchi2->Draw();
canvas.Draw();
canvas = ROOT.TCanvas()
histchi2.Draw()
canvas.Draw()
Tip
While we have to explicitly Draw a canvas, we can re-use a
previously-defined canvas (the same way command-line ROOT keeps
re-using c1).
Follow the above examples to make histograms of the other variables in the n-tuple.
Hint
I will permit you to use copy-and-paste (in a notebook) or the up-arrow key (if you’re using the command line) to speed up this task. The fact that I have no way to stop you has nothing to do with it.

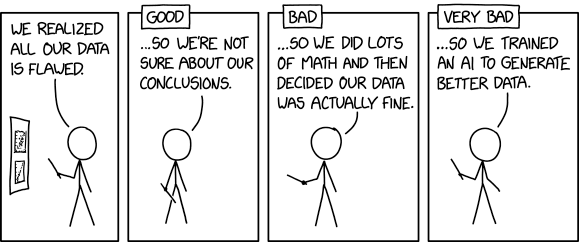
Figure 34: https://xkcd.com/2494/ by Randall Munroe