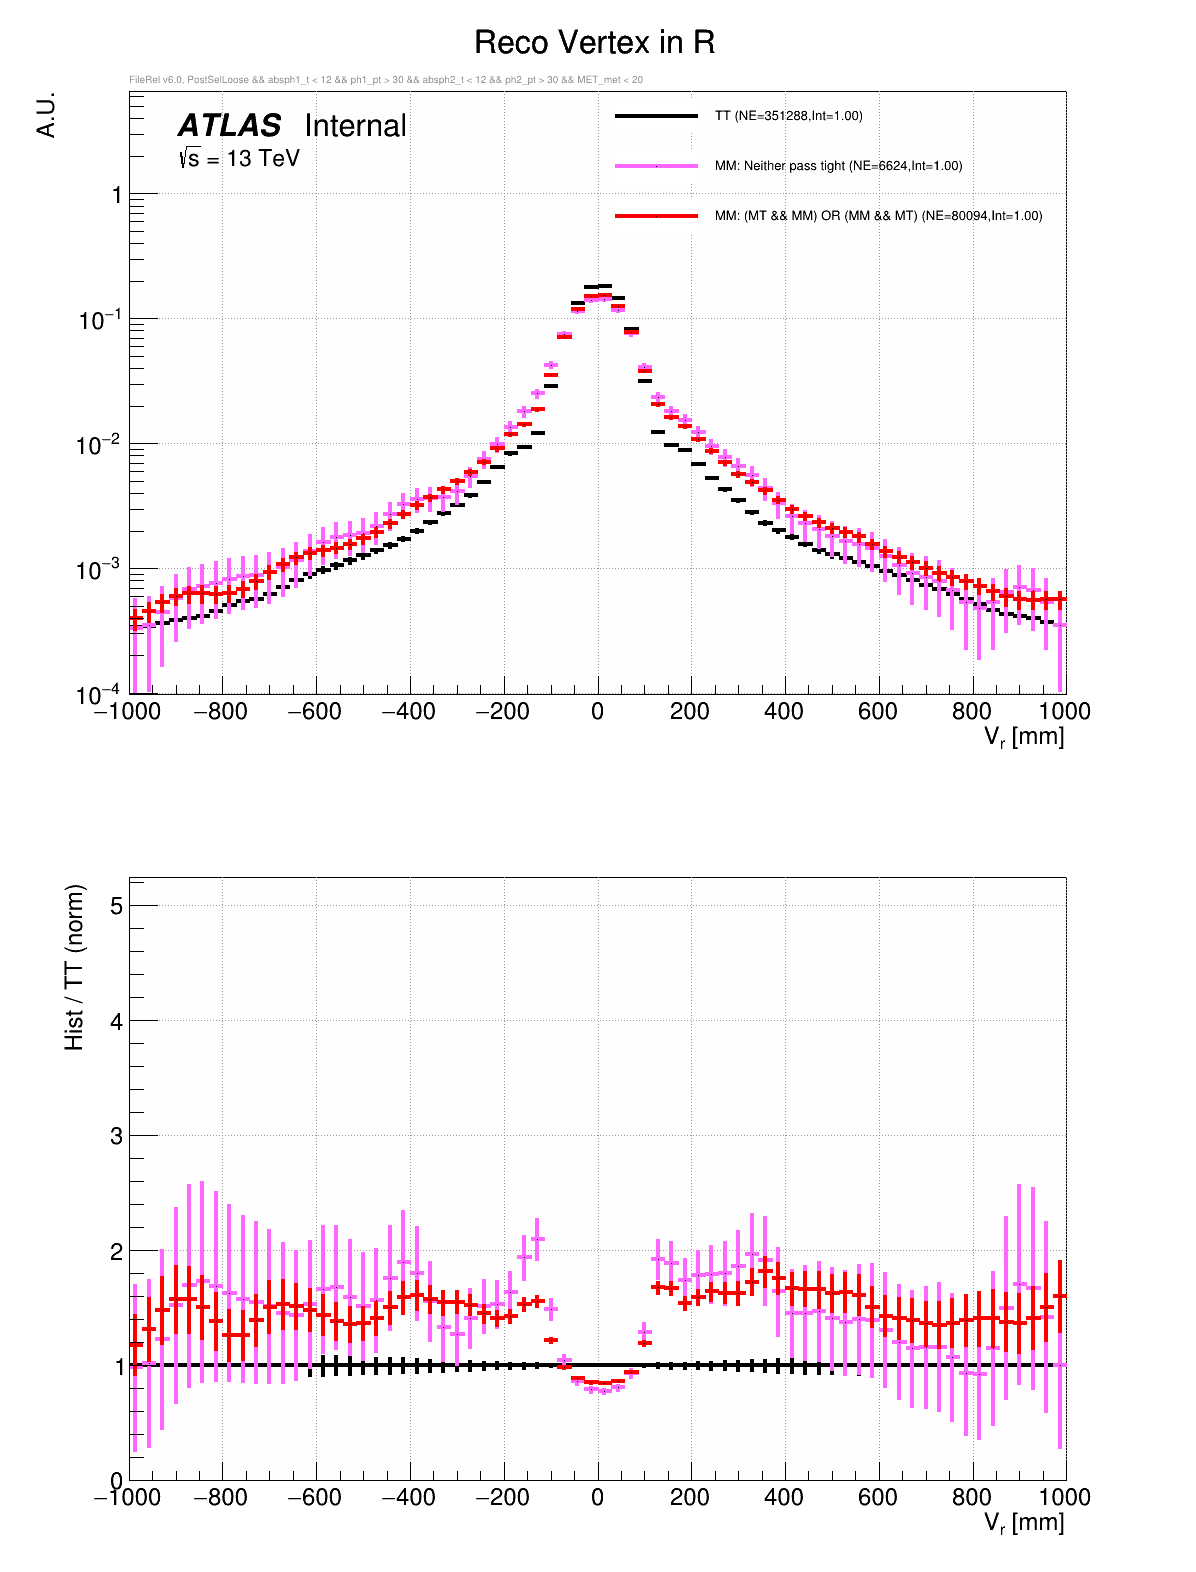
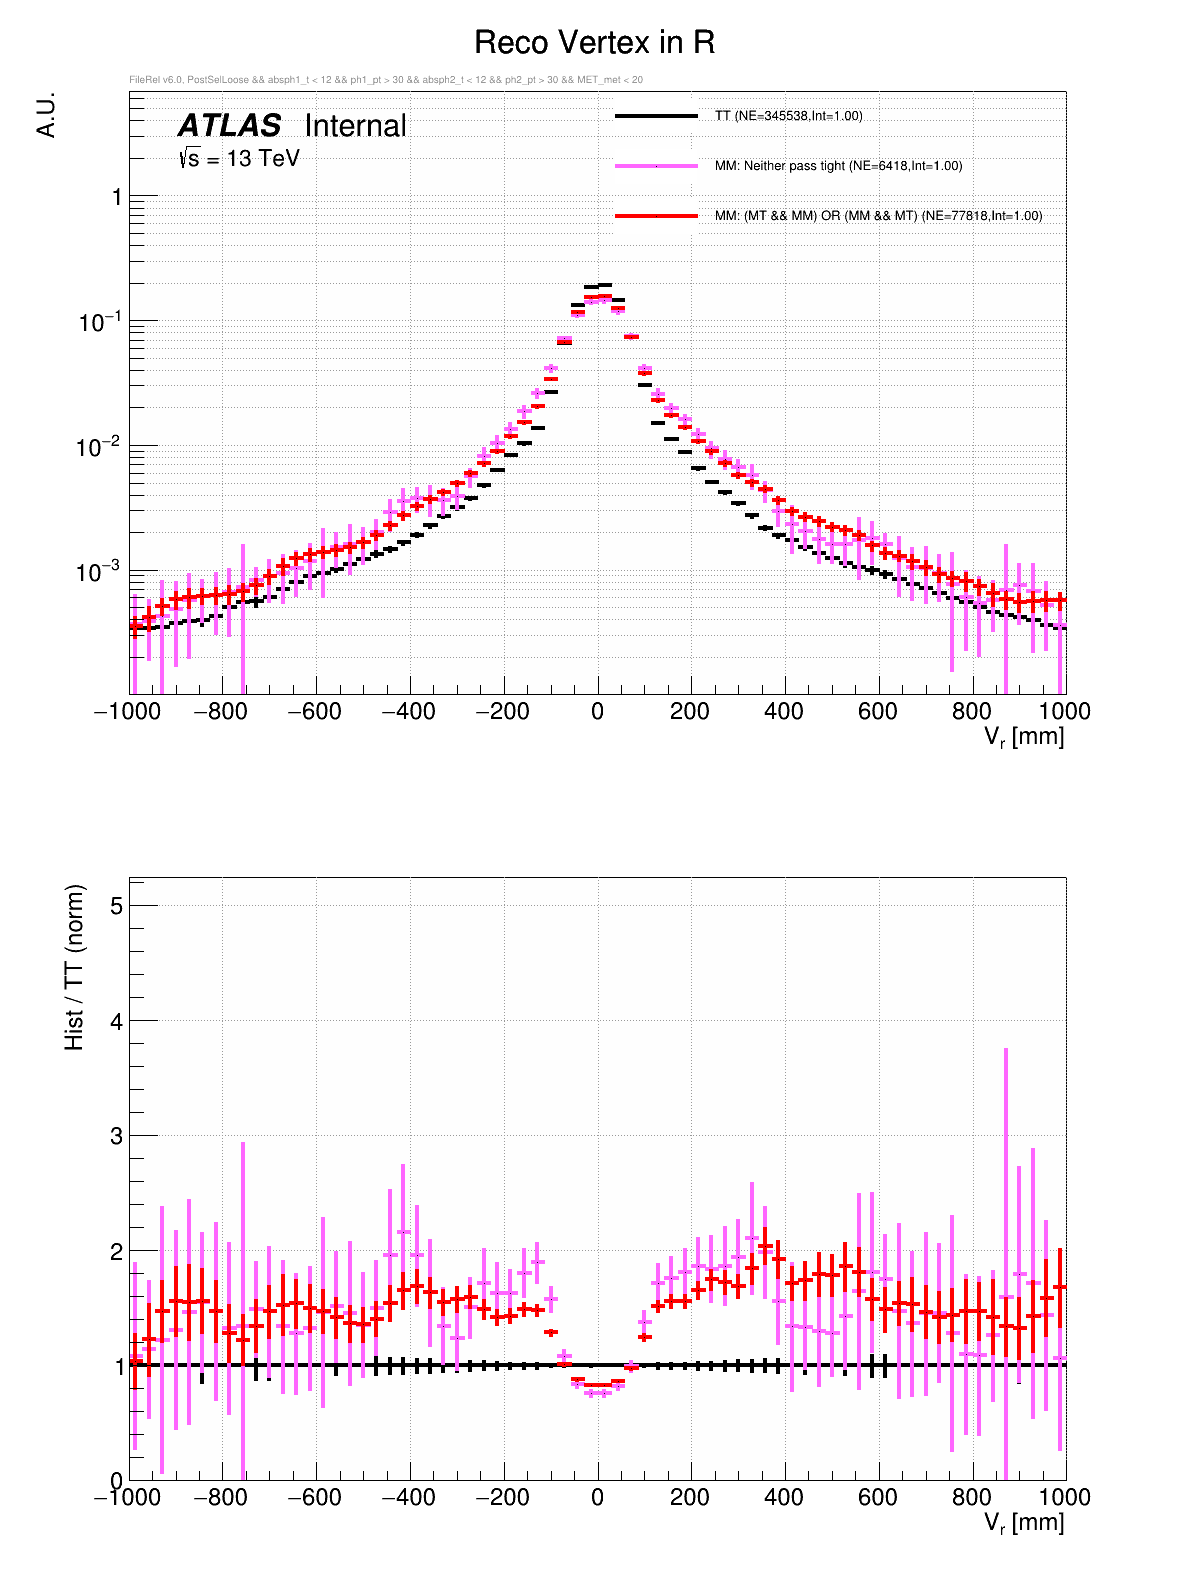
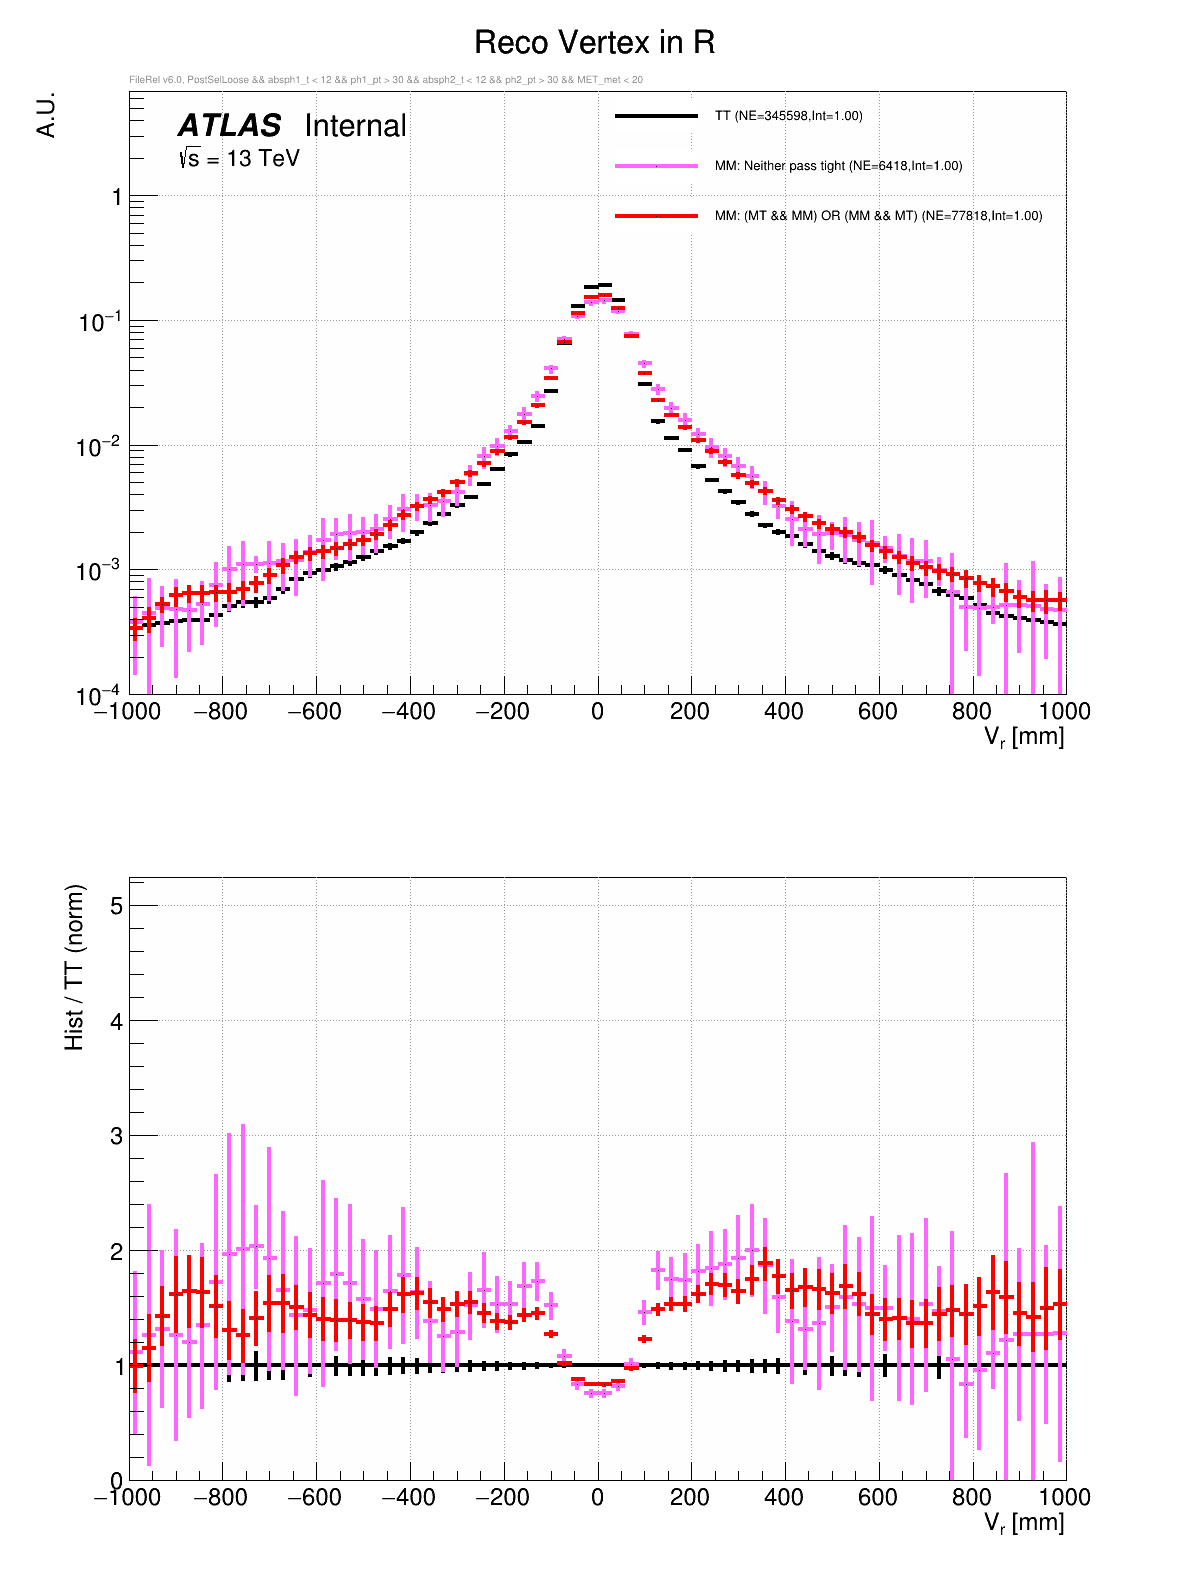
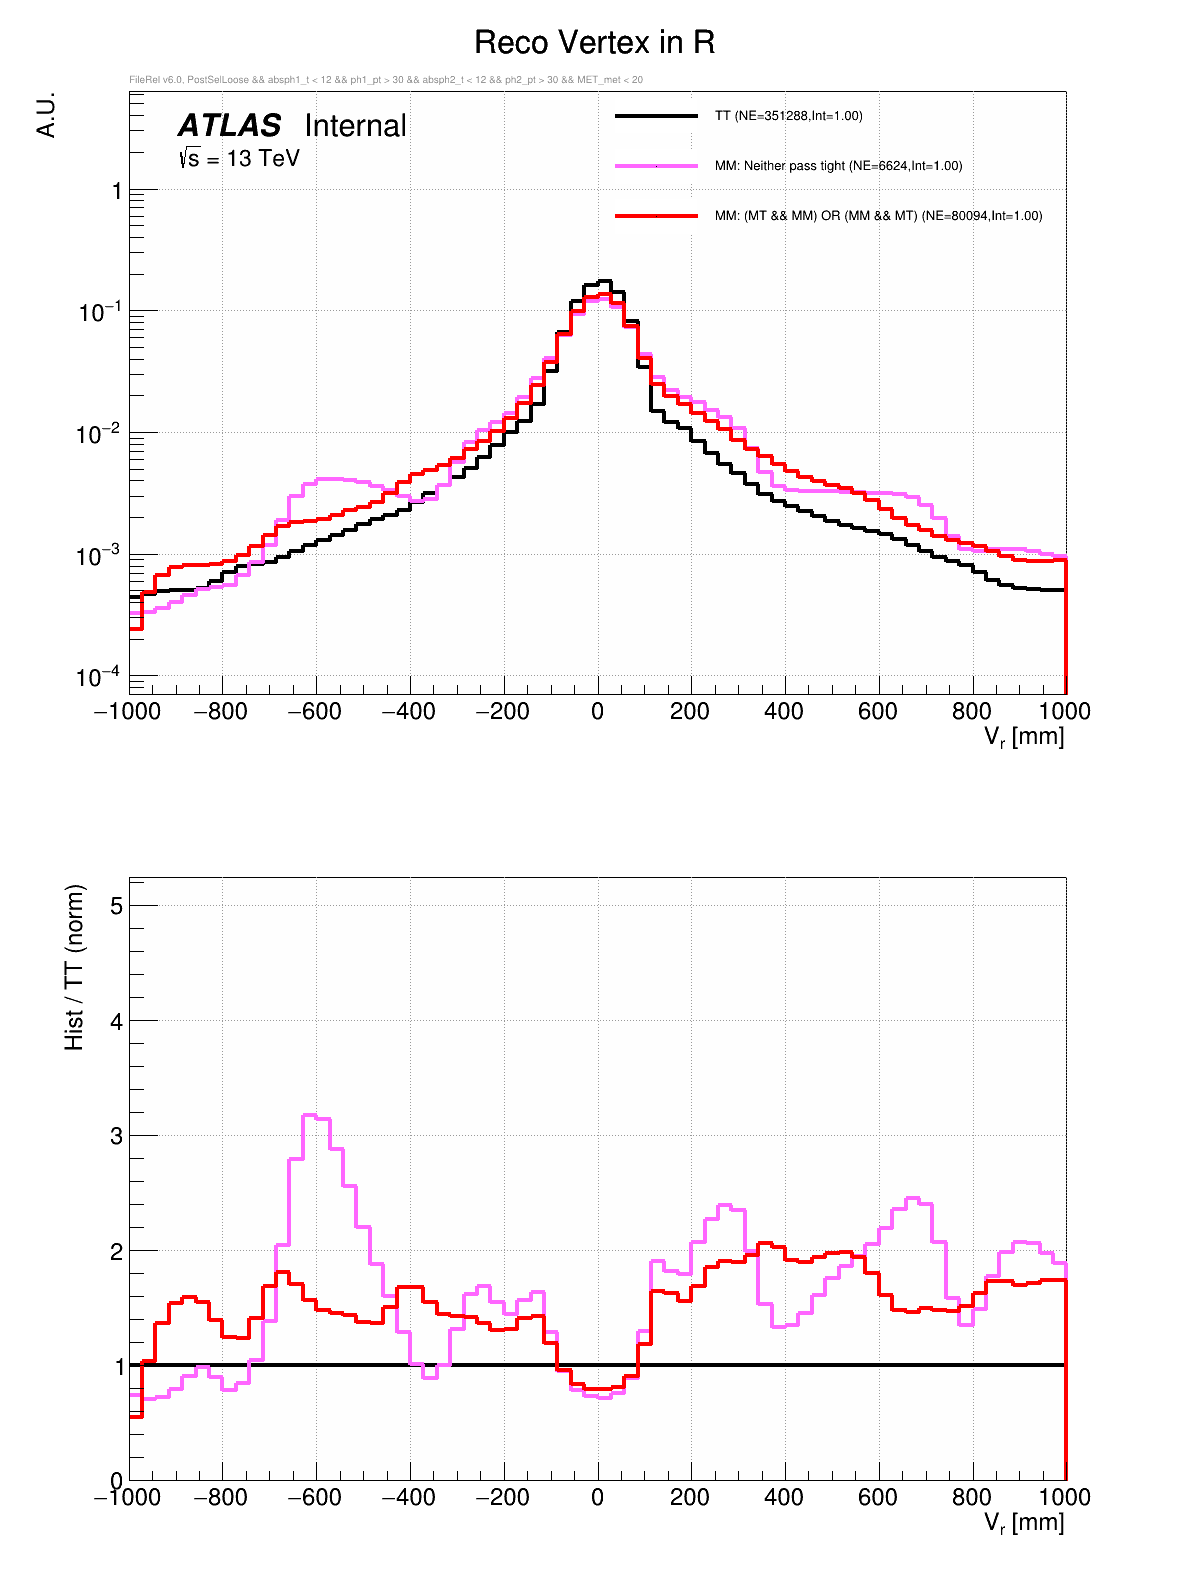
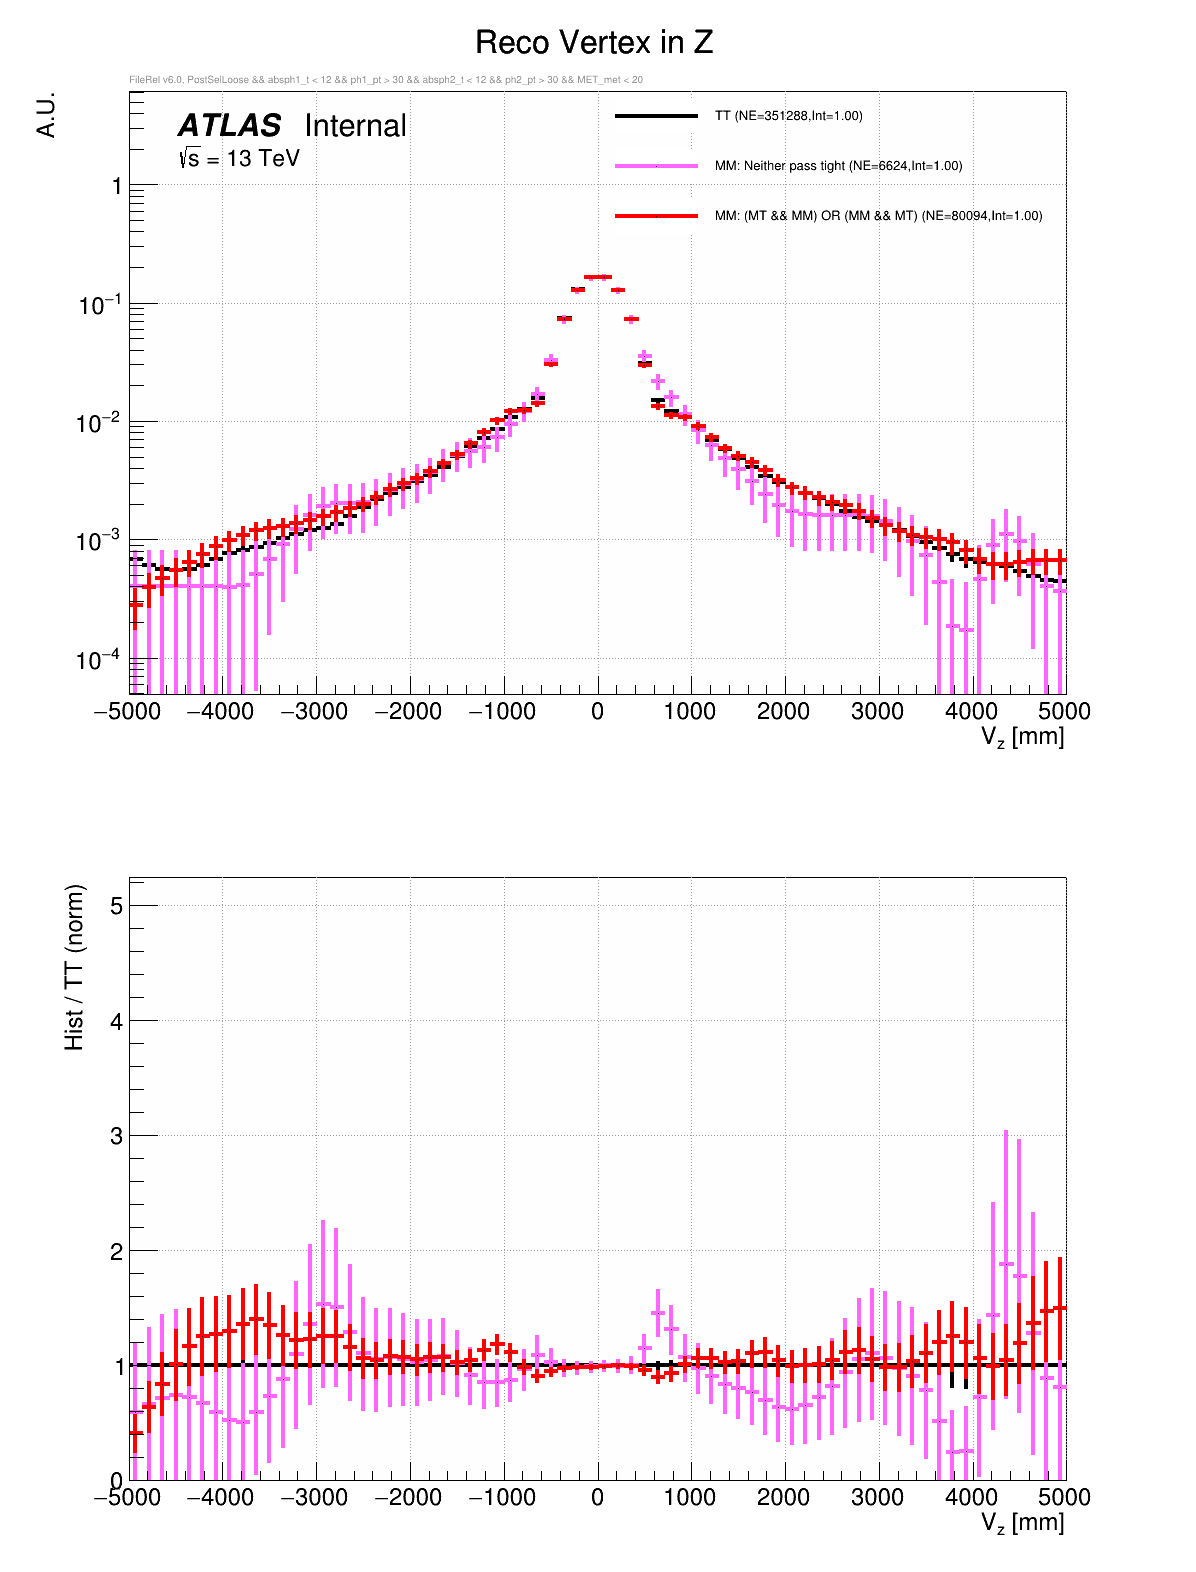
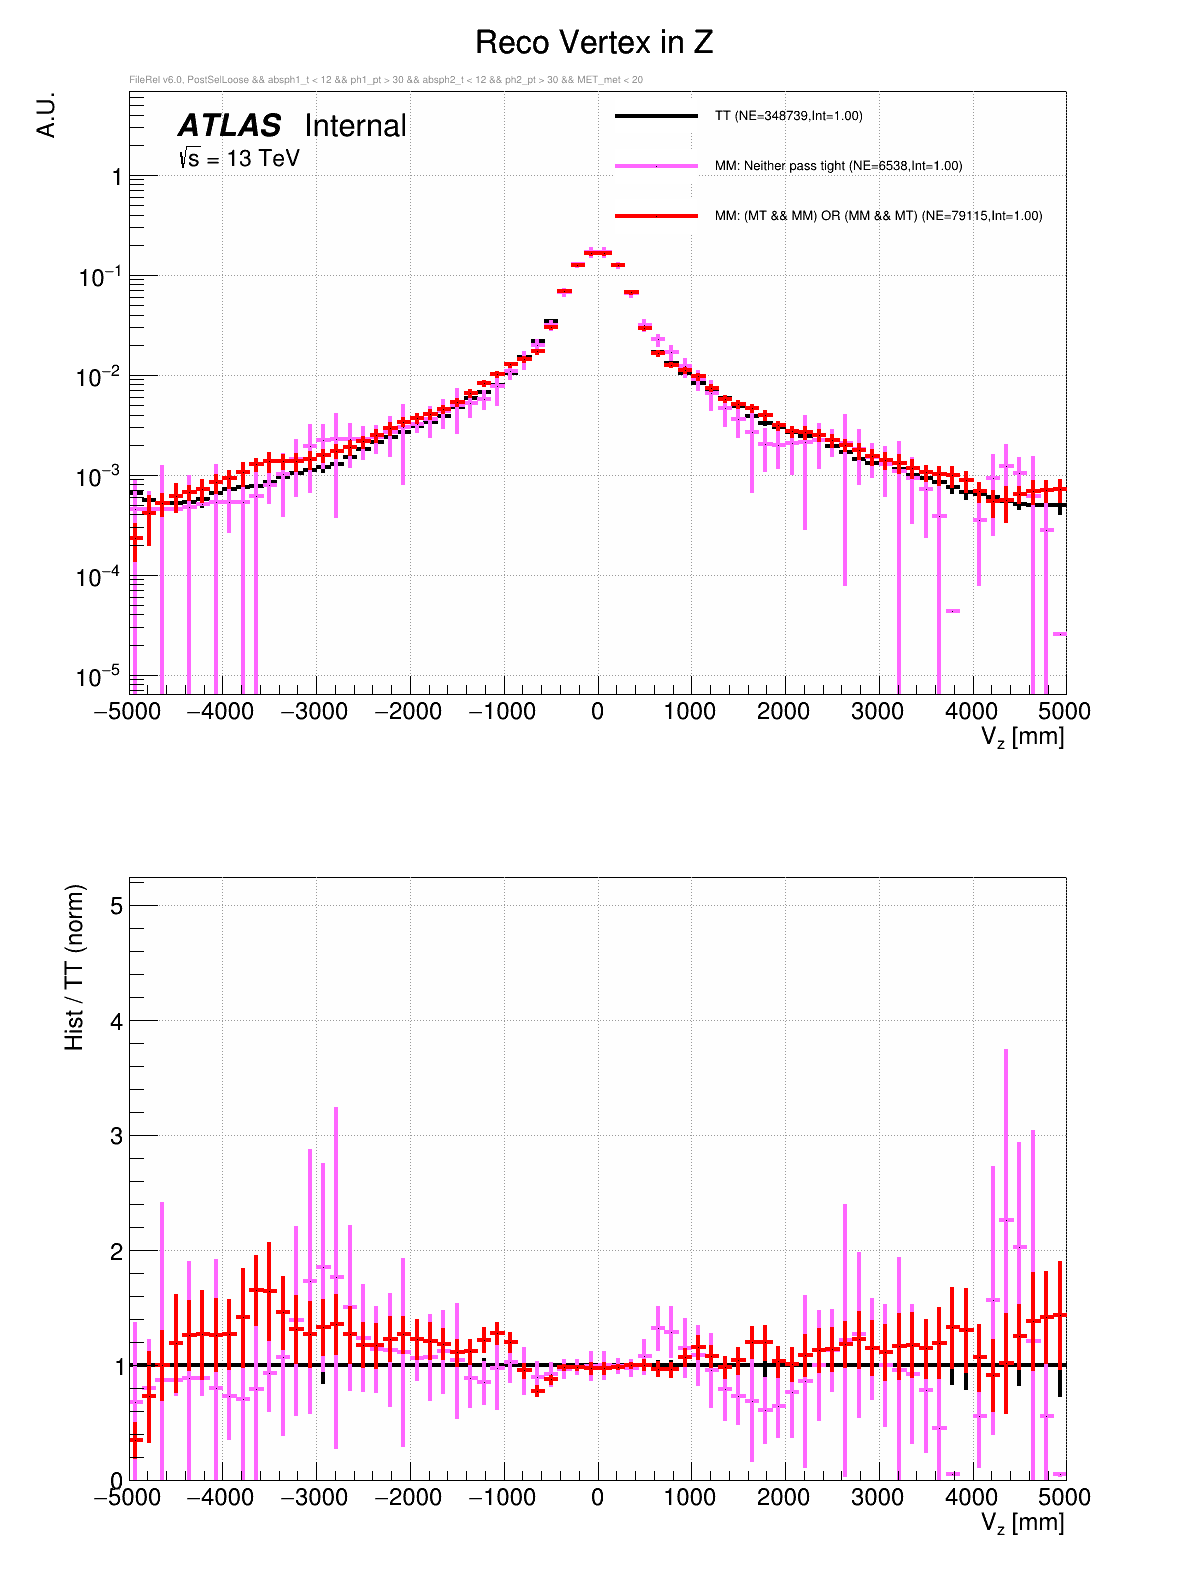
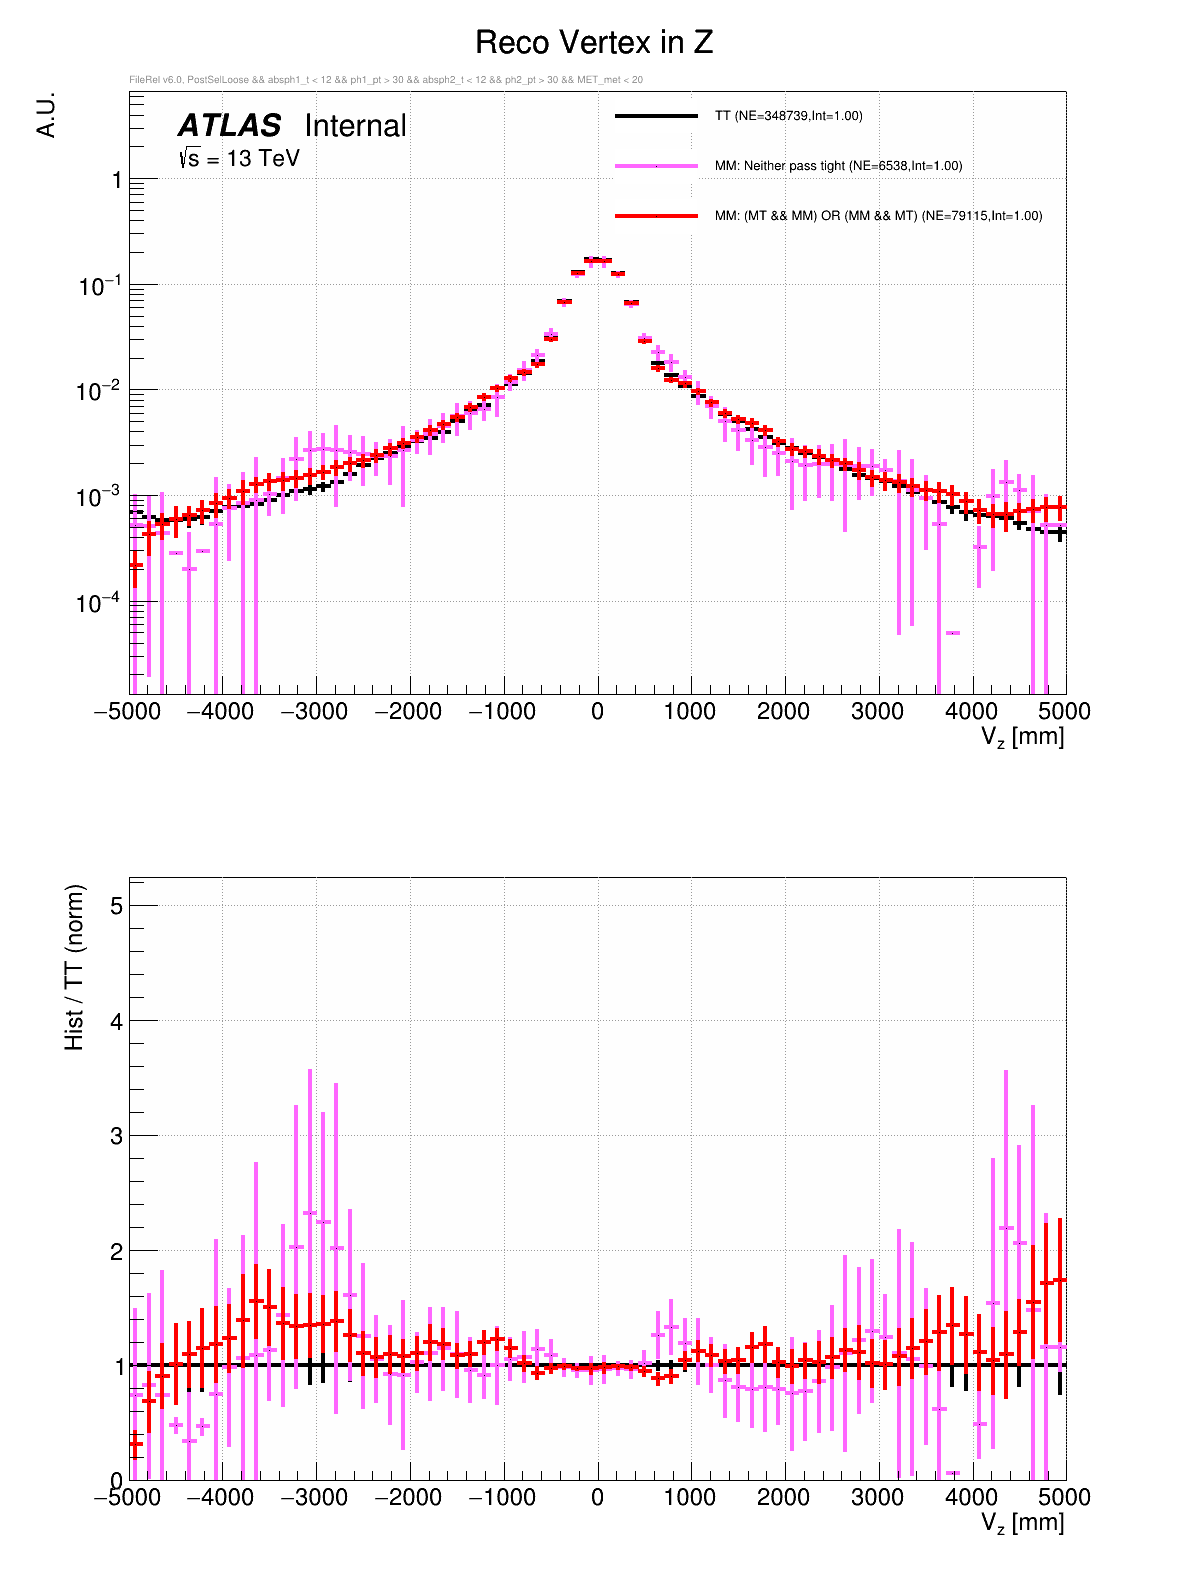
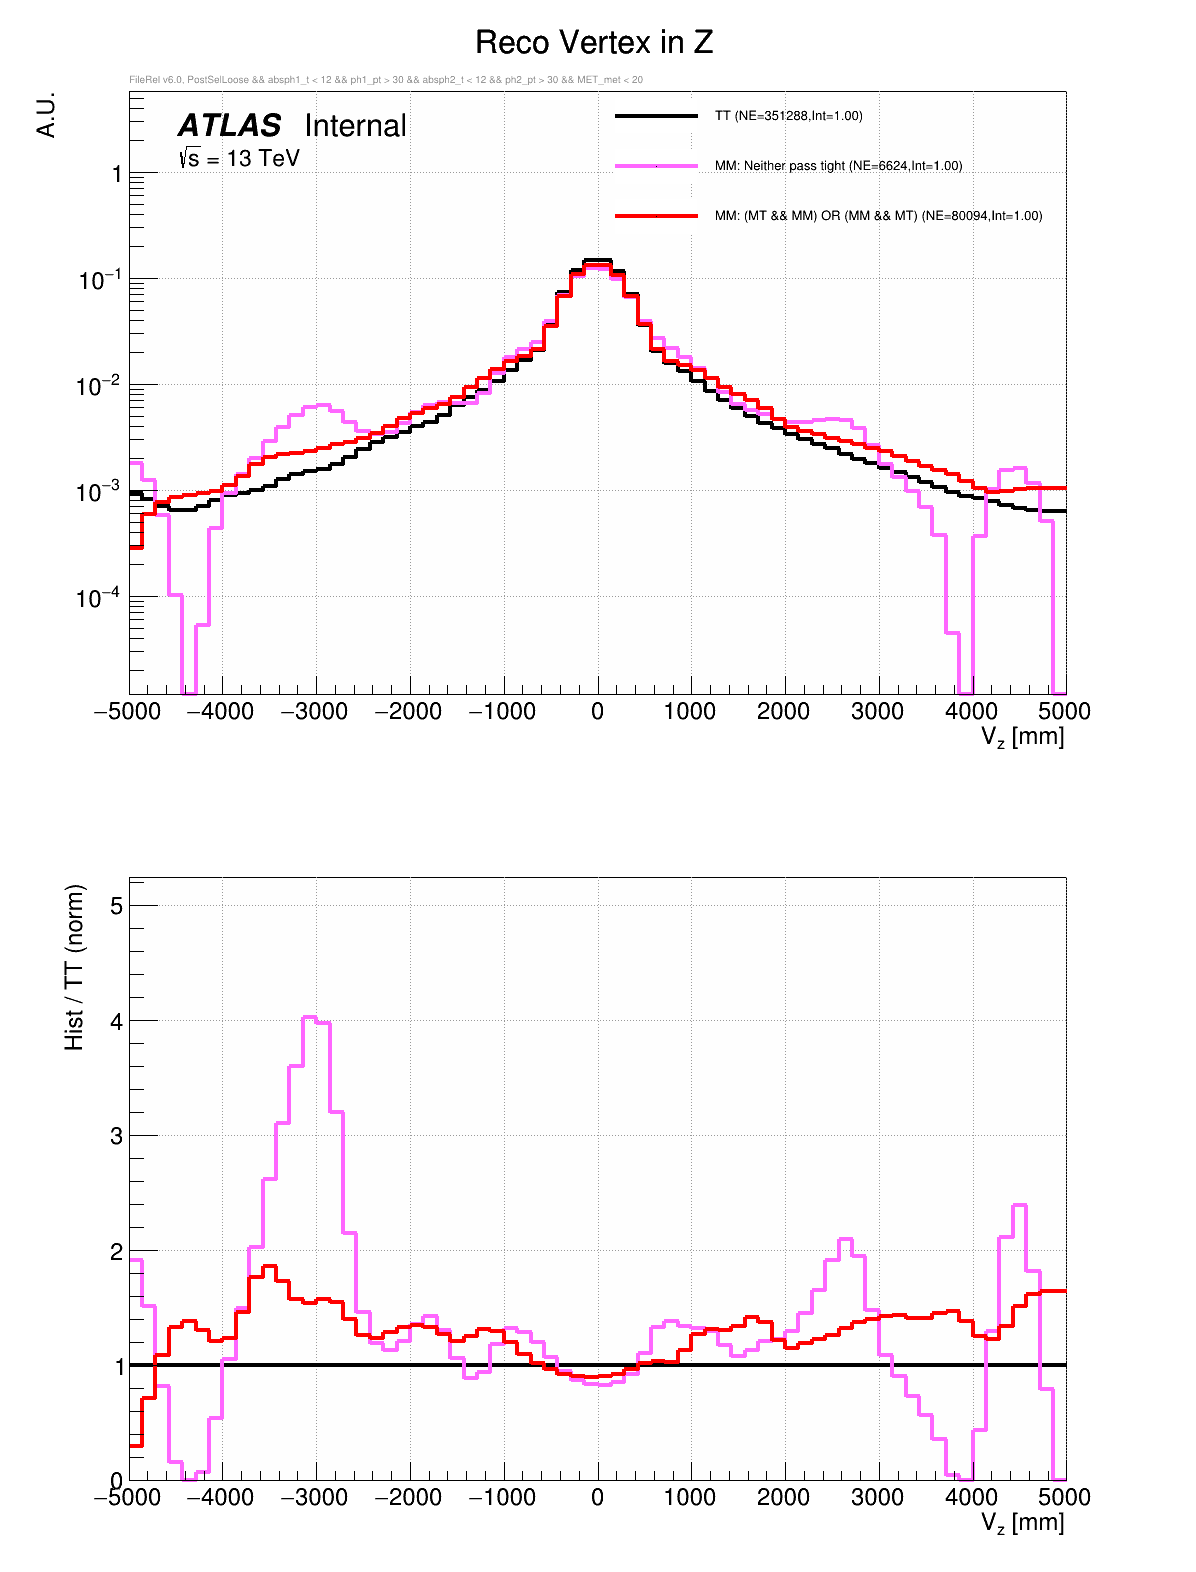
○ Comparing TT, MM (neither pass tight), MM (one is medium not tight and one is tight).
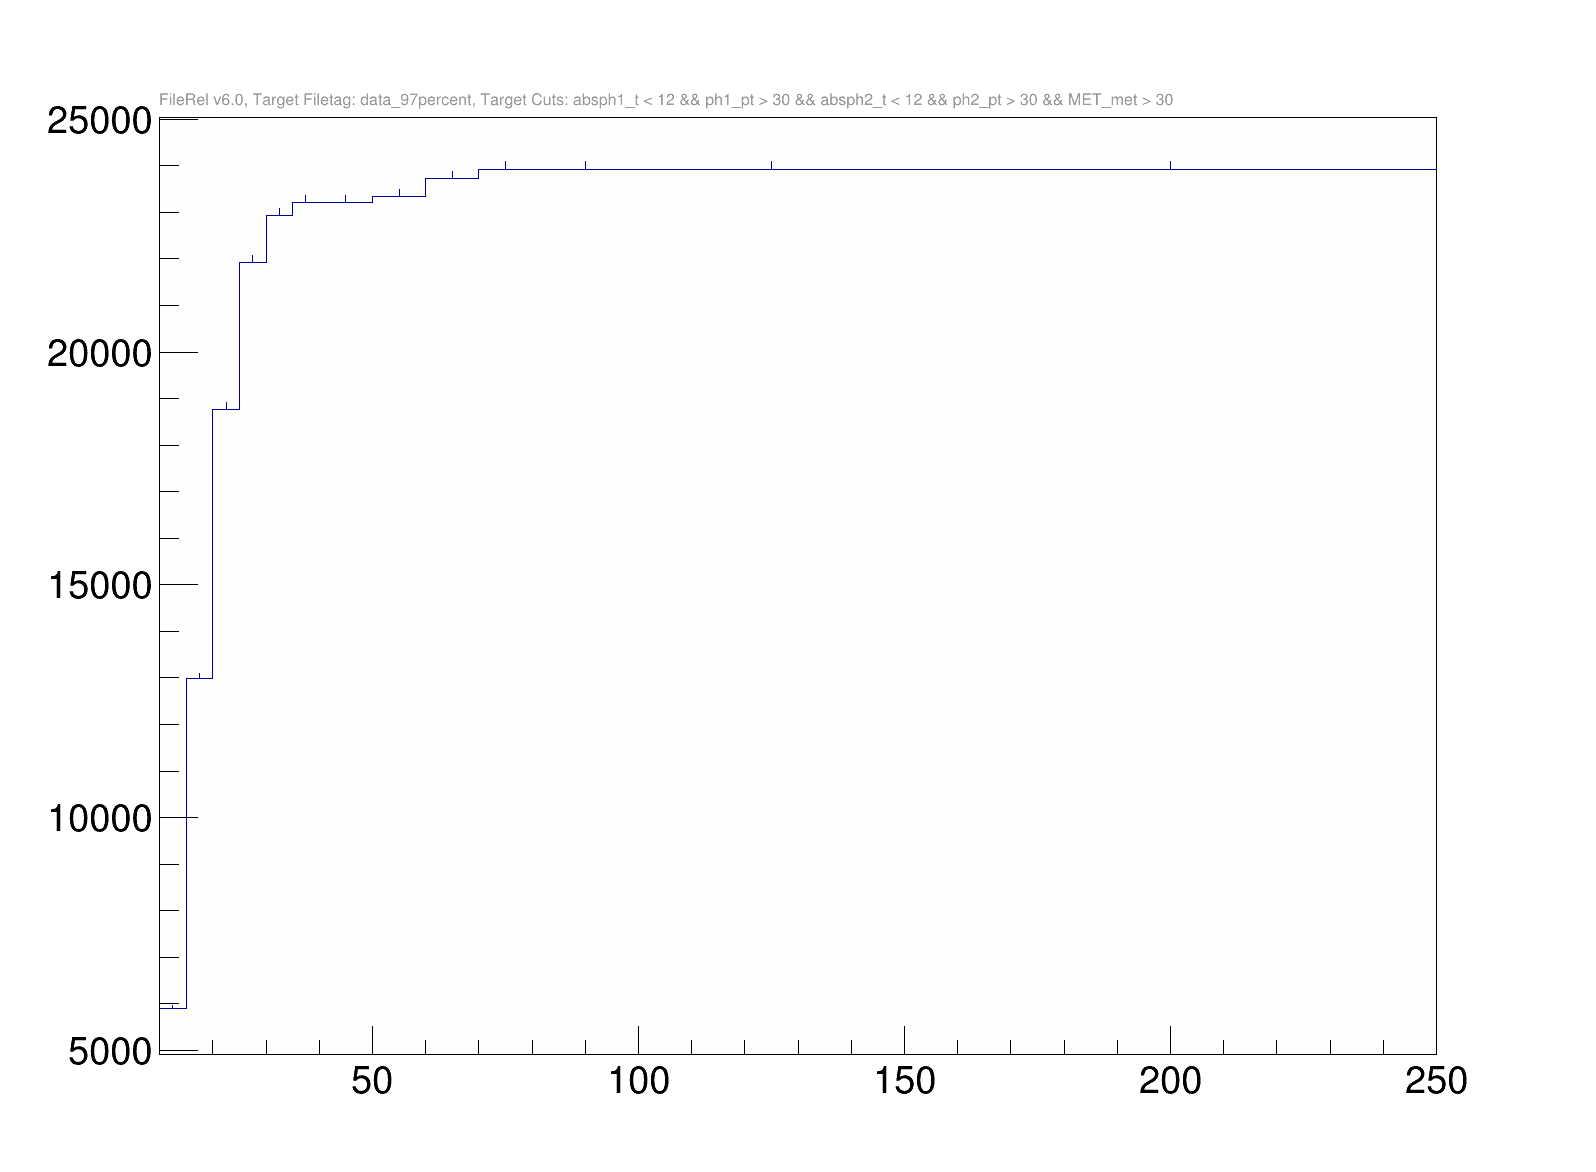
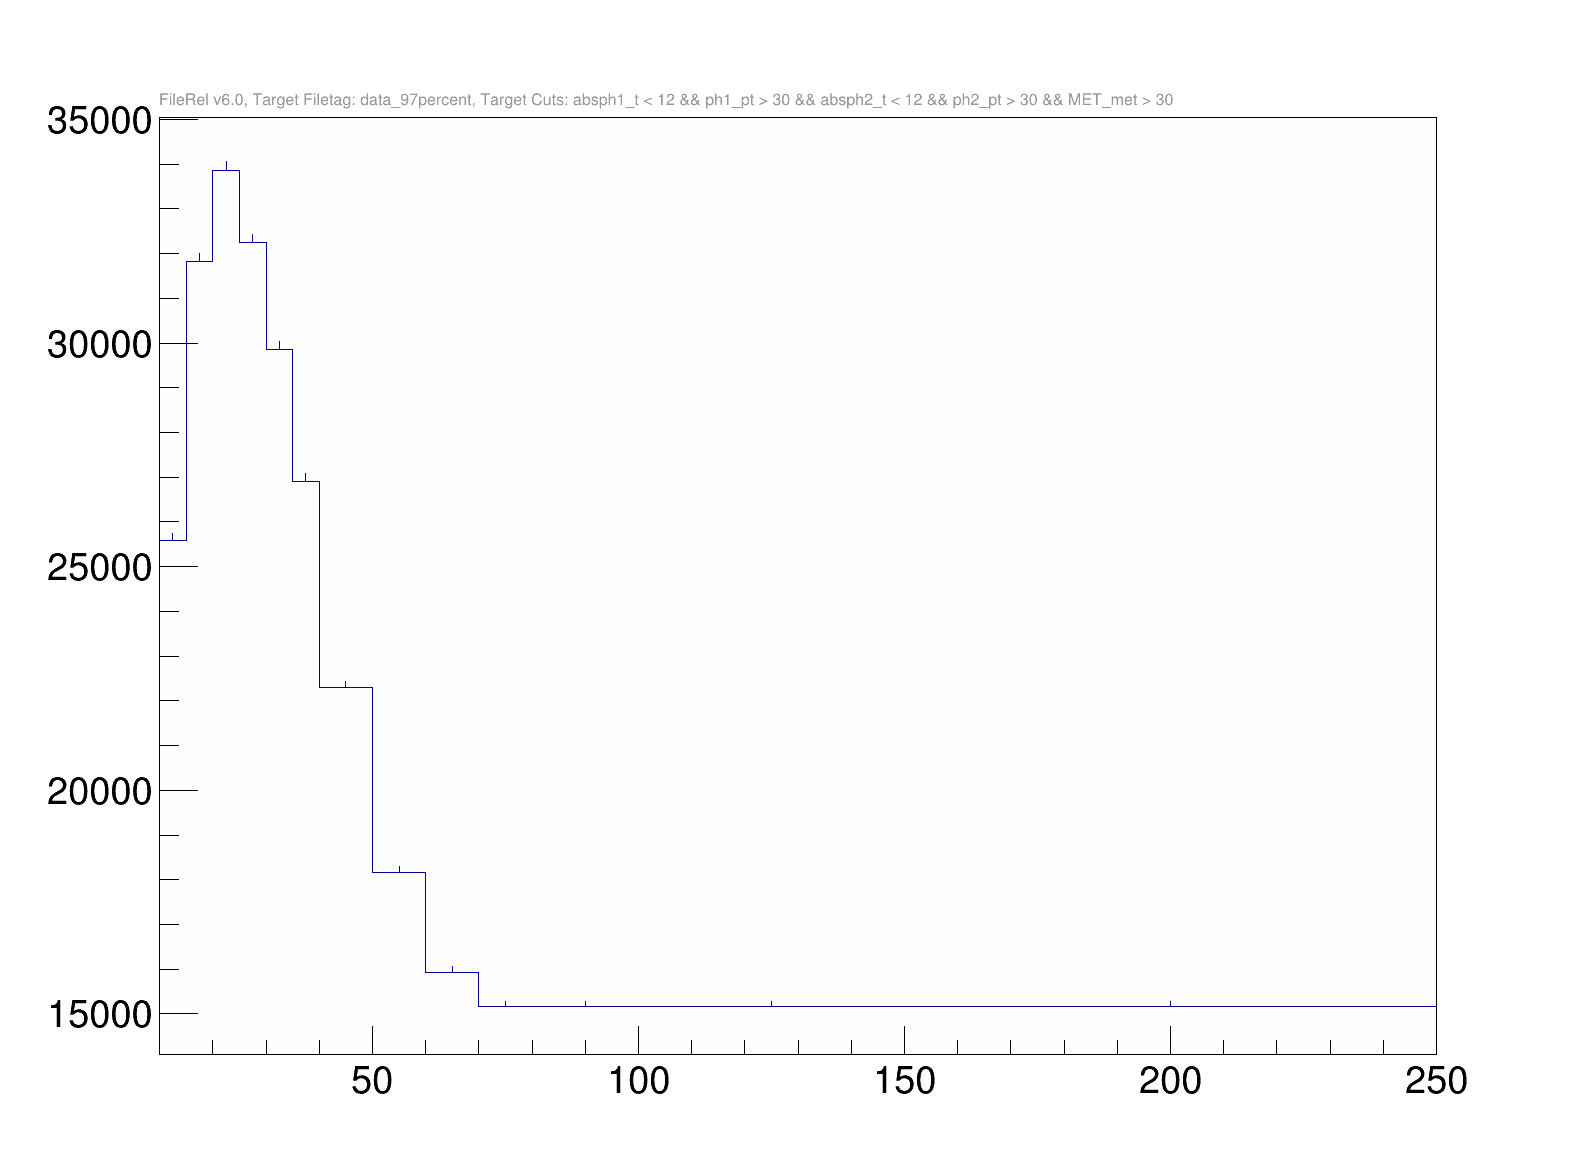
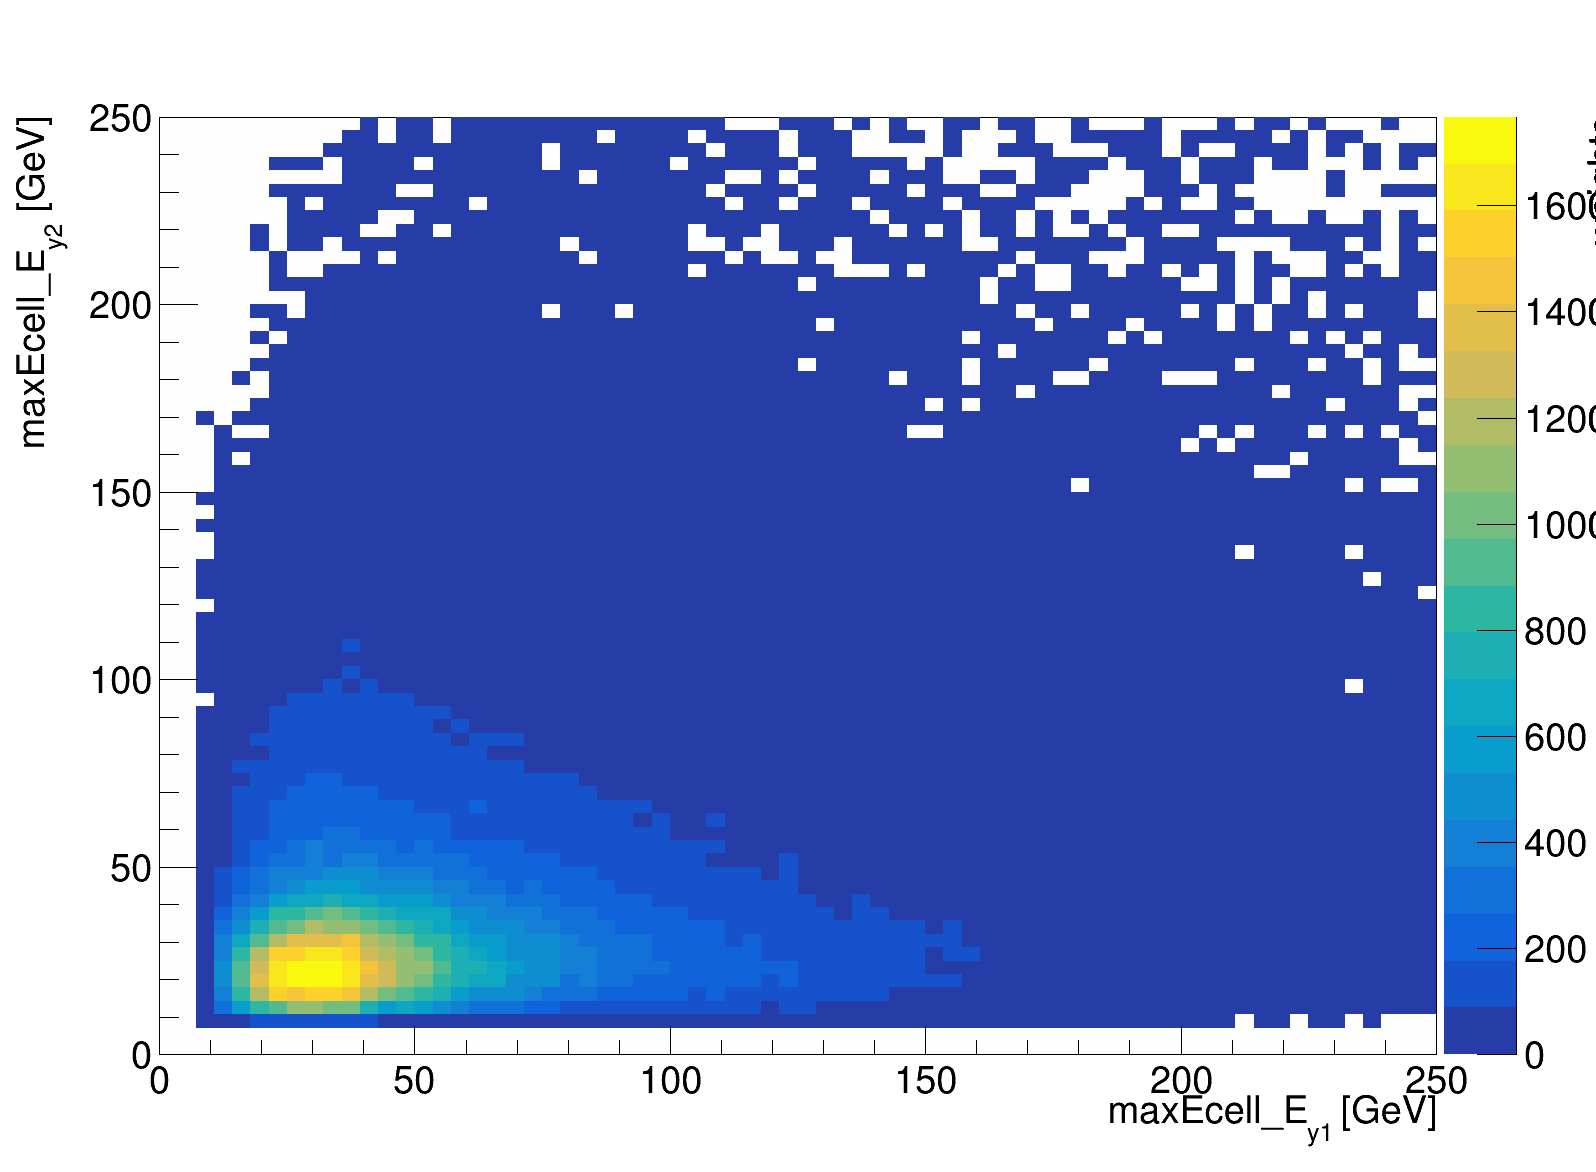
○ Reweighted CR distributions to the SR MaxEcell_E energy distribution.In 1D to ph1_maxEcell_E, in 1D to ph2_maxEcell_E, and in 2D to both photons.
○ Smoothing histogram.
| Unweighted Plots | RW ph1_maxEcell_E | RW ph2_maxEcell_E | RW2D both photons |
|---|---|---|---|
 |
 |
 |
 |
| Unweighted Plots | RW ph1_maxEcell_E | RW ph2_maxEcell_E | RW2D both photons |
|---|---|---|---|
 |
 |
 |
 |
| RW ph1_maxEcell_E | RW ph2_maxEcell_E | RW2D both photons |
|---|---|---|
 |
 |
 |