Systematic errors
A statistical error is one that’s due to some inherit randomness in your process of making a measurement. A systematic error comes from a consistent bias in that measurement, but you don’t know how much that bias is. The systematic error is the limit you assign to the potential range of that bias.
To explain this concept, I like to start with that old statistics example: measuring the size of a table with a ruler. You repeat this measurement every day. There is some variance in the day-to-day measurement: you tilt your head differently, the light in the room depends on time of day, you’re feeling tired that day, etc.
There’s a reasonable chance that if you were to plot these measurements, the result would look like a Gaussian distribution. The standard deviation of that distribution would be related to the statistical error in your measurement.
To understand the systematic error in the measurement, you have to ask: How do we know that 20cm as measured on your ruler is the same as 20cm as measured on mine? Or 20cm as measured by the Physics Department of Polytechnic Prep in Birnin Zana? Or the International Committee for Weights and Measures in Saint-Cloud, Hauts-de-Seine, France?
Figure 102: https://xkcd.com/2073/ by Randall Munroe
I’ll give you a hypothetical chain of reasoning along the lines that a physicist (or a metrologist) might use to think about systematic errors. Assume that your ruler is similar to the one sitting next to my desk right now, a cheap one I purchased at a drug store 30 years ago.
The ruler is made of plastic. I assume liquid plastic was poured into a mold then allowed to harden. What are the thermal characteristics of this particular type of plastic? Does it shrink when it’s cooled? Does its shape distort when it gets hot in my apartment? Has it become warped over the past 30 years due to the age of the plastic or the conditions in which I’ve stored it?
If a metal mold was used to shape the plastic, does it have thermal characteristics of its own? It might have been shaped at room temperature, yet plastic is poured into it at some higher temperature. Is this temperature variation enough to distort the mold to some degree?
How was that mold made? Did it start out as a block and then was shaped at a tool-and-die factory? What was the precision of the drill, mill, or press used to create that mold?
Who manufactured that drill, mill, or press? How accurate was the tool that made it?
And so on.
Your probable reaction to the above list is that all these effects are too small to worry about for an actual 30cm plastic ruler being used to measure a typical living-room table. Let’s consider a more realistic scenario: the imaginary experiment mentioned in Figure 100, the discovery of the P particle.
For the purposes of this example, the P particle is hypothesized to be emitted by a rare decay of Vb299. The energies of the decay products of Vb299 are measured with a calorimeter. The detector setup is located under the Jabari mountains, but even so enough cosmic rays get through to be a substantial background for the rare signal they’re trying to detect.
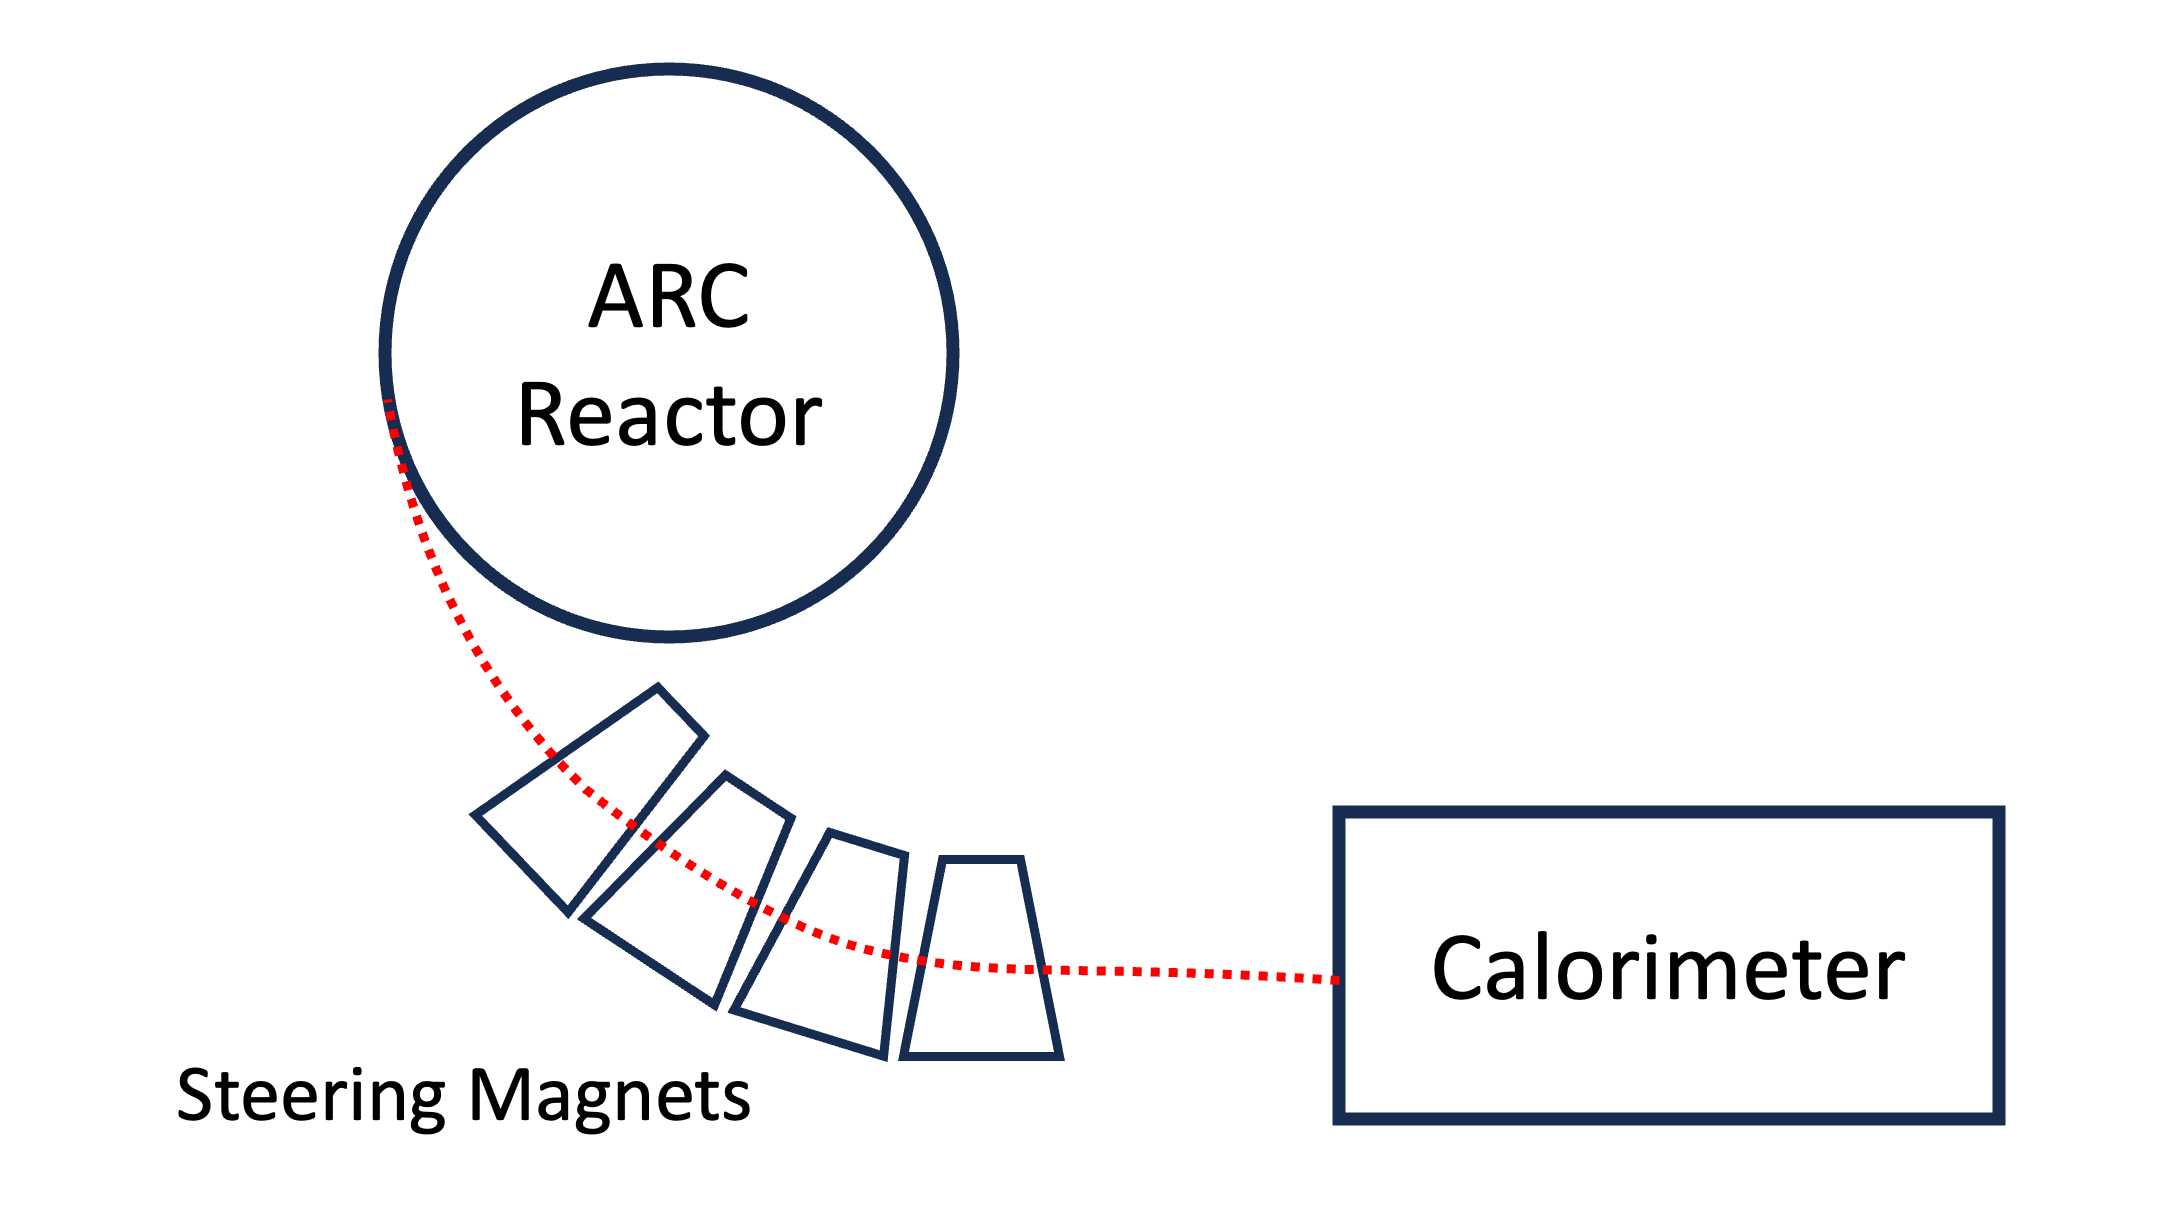
Figure 103: This is a sketch of the calorimeter calibration described below. It is fictional; an actual detector-calibration setup would be more complex, have a physically accurate beam trajectory, and would involve technologies that actually exist (unlike an ARC reactor).
The calorimeter measures the energy of the particles and returns some value in millivolts. You have to calibrate the calorimeter, to translate those millivolts into WeV. The typical way to do this is to shoot a beam of particles of known energy at the calorimeter, and see how many WeV corresponds to the calorimeter output in millivolts.
A calorimeter has some energy resolution. Even if you shoot a beam of known energy into one, you’re going to see a spread in the resulting detector response. Perhaps that distribution will look like a Gaussian, but you’ll still have to fit it. Take another look at Figure 94. There’s a fitting error associated with the mean and sigma of the distribution. The width of that distribution is your energy resolution; the error in the mean is a systematic error of your energy calibration.1\(^{,}\)2
What is the exact energy of that beam of electrons used to calibrate the calorimeter? The electrons might be extracted from an ARC reactor and sent through a chain of focusing and steering magnets. The final step is to point the calibration beam at the calorimeter with a bending magnet to select those electrons with a given energy. The mean energy of the beam will depend on the magnetic field of the final bending magnet. How well do you know that magnetic field? That will be another source of systematic error.
You have to separate the energy signatures of the P particle from those of the cosmic rays that pass through the calorimeter. How well can you identify the event type? You’ll apply various analysis cuts (there are examples of this in the main ROOT tutorial), but there’s always a limit to their efficiency, for another source of systematic error.
The above were sources of experimental systematic error. Now let’s consider a theoretical systematic error: Both Dr. Shuri Wright and Dr. William Ginter Riva have published models of the predicted energy spectrum from Vb299 decays involving the P particle. The separation of your signal from the cosmic-ray background depends on the model. You must perform your analysis with both models and treat the difference as a theoretical systematic error.
You may feel that these examples are as unimportant as the systematic errors I hypothesized for the ruler,3 but they were adapted from cases within experiments I’ve worked on, The relative sizes of such errors are much larger than the errors in a plastic ruler due to a milling machine. If anything, I’ve underestimated the number of systematic errors considered in a typical physics experiment.
In case my fictional example left you dubious about the concept of systematic errors, here’s a systematic error table from a real physics analysis. Note how the total error at the bottom is dominated by the systematic errors over the statistical errors. In particular, the largest systematic error is “ISR and FSR” (Initial State Radiation and Final State Radiation) which is a theoretical systematic error.4
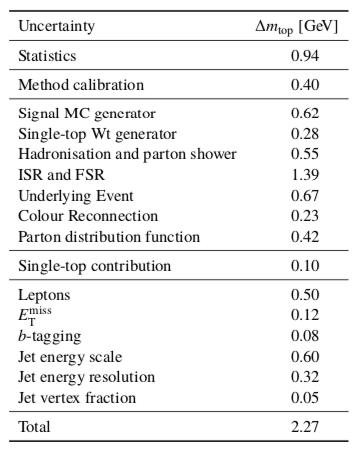
Figure 104: From ATLAS PUB Note ATL-PHYS-PUB-2018-001 31st January 2018 Investigation of systematic uncertainties on the measurement of the top-quark mass using lepton transverse momenta
I did a lot of hand-waving to condense what little I know about statistics into these pages without (I hope) getting too bogged down in the math. If you’d like more rigorous explanations of these concepts, see my list of statistics books.
Anyone can make a measurement. Understanding the error on that measurement is the true skill of a physicist.
Figure 105: https://xkcd.com/2110/ by Randall Munroe
Note
Don’t laugh too quickly. Adding statistical and systematic errors can be a tricky business. Often an experiment will report them separately, and sometimes will plot them in a similar way as this cartoon.
- 1
For a \(\chi^{2}\) fit, the uncertainty in a parameter comes from shifting that parameter and looking at its change about the minimum when \(\chi^{2}\) varies by ±1. I don’t expect you absorb that bit of arcane trivia right now; it’s enough to know that any fits to points with error bars will necessarily have error estimates in the fit results.
By the way, this is the answer to the statistics question I posed back in Fitting a Histogram.
- 2
The error in the mean from fitting to the detector response is usually reported as the “energy calibration.” The standard deviation of that fit is the “energy resolution.” You’ll usually see these two reported separately (as in Figure 104).
In my thesis experiment, it took us years to understand both the energy calibration and the energy resolution, and their correlation with each other. In part this is because they’re also a function of energy; e.g., the energy resolution is often reported using a formula like \(\sigma(E)/E=K/\sqrt{E}\), where \(K\) has to be determined by the analysis.
- 3
You might be justified in this impression given the obscure pop-culture references. If you didn’t get the references, do a web search on Birnin Zana, then ask yourself which element is Vb299 and what WeV stands for.
- 4
Let’s add up those individual errors. Wait… the total is 7.27, not 2.27! What’s happening?
The answer is that the errors are being added in quadrature. If a given error is \(\delta_{i}\), then adding them in quadrature means to compute \(\left(\sum_{i} \delta_{i}^{2} \right)^{1/2}\).
But that computation assumes that none of the systematic errors are correlated; i.e., there are no \(\delta_{i} \delta_{j}\) terms with \(i \neq j\). Is that necessarily true? For example, in Figure 104, what if the “Jet energy scale” was correlated with the “Jet energy resolution”?
At this point, you may be coming to understand the complexity of handling errors in a physics analysis.